[Crypto Trading Using Zig Zag Indicator]- Crypto Academy /S6W1-Homework Post for kouba01
Thanks to our professor @kouba01 for this wonderful lesson about "Crypto Trading Using Zig Zag Indicator". I learned many new things from this lesson and by the time of doing my homework task. Now I am submitting my homework task. Let's get started:

1- Show your understanding of the Zig Zag as a trading indicator and how it is calculated?
Zig Zag as a trading indicator
Zig Zag indicator is a technical analysis tool. It is based on the support and resistance levels and also ignores the small price movement in the market. It also eliminates the noise of everyday market conditions. This basic tool is great for determining the swing highs and swing lows.
The tool connects lines of the minimum and maximum price of an asset. The indicator reflects its past movements and does not provide buy or sell signals. It only indicates the swing highs and swing lows in the market. That's why the indicator is not for any signals. But it can be used to understand a trend in the market. That helps in the integral analysis of trade.
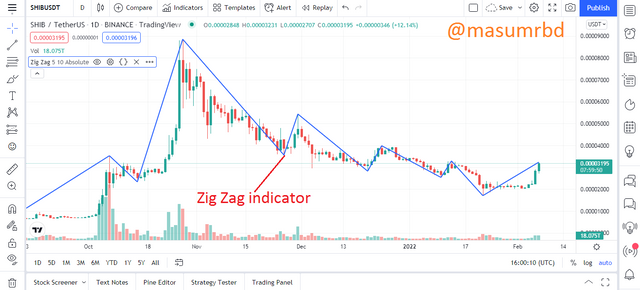
Here you can see in the screenshot below taken from TradingView the example of the ZigZag trading indicator in SHIB/USDT Chart-
Calculation of Zig Zag as a trading indicator
The Zig Zag line calculation on a candlestick is calculated based on the maximum and minimum price. It uses the closing price as its reference. The Zig Zag line is made from the analysis of past data. That's why It does not work in a predictive way. Though it is not predictive conjugation with the Elliott Wave indicator gives the best results.
The last point in the indicator is not taken into consideration. Because the Zig Zag line is not completed yet. It worked based on the historical data and that's why the last line may change its position.
2- What are the main parameters of the Zig Zag indicator and How to configure them and is it advisable to change its default settings? (Screenshot required)
The main parameters of the Zig Zag indicator
If we see on the Tradingview we can see the two parameters of the Zig Zag indicator-
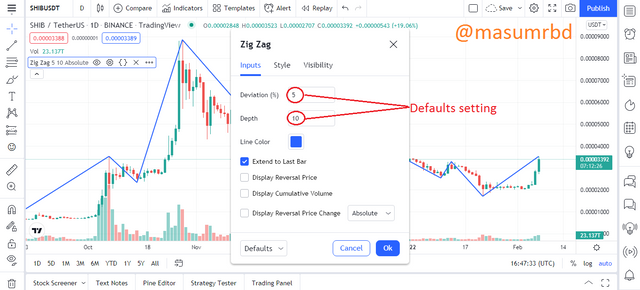
1- Depth: The default value of depth is 10. Depth refers to the minimum distance where the minimum and maximum are not represented and it will differ from the previous one.
2- Deviation: The default percentage of deviation value is set to 5 represents a percentage. A new peak is identified in this stage. Deviation refers to the minimum price change which must be maximum or minimum from the previous maximum or minimum.
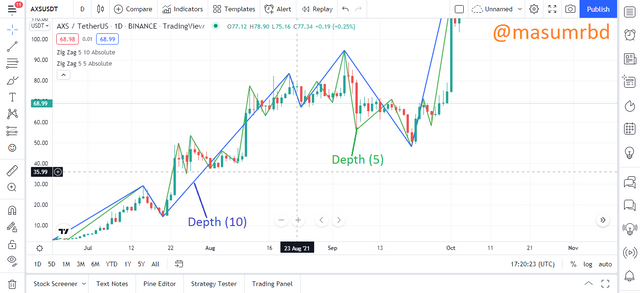
A small change in the Zig Zag indicator varies different results. Some results are not useful. Traders generally customize the depth value but very carefully. Because the too low value of the depth will show numerous false microtrends and the higher value will draw unrealistic lines that will be totally worthless.
To give you a better idea here I added two depth valued Zig Zag lines 5 (Green) & 10 (Blue) color lines on Tradingview-
3- Based on the use of the Zig Zag indicator, how can one predict whether the trend will be bullish or bearish and determinate the buy/sell points (screenshot required)
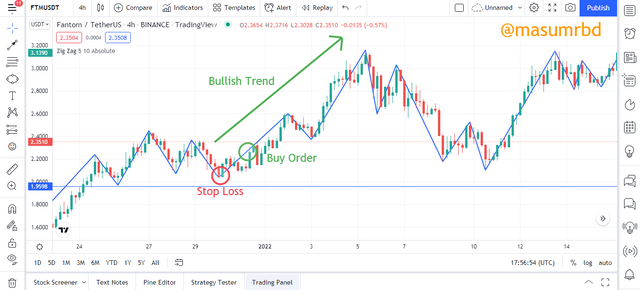
Determining bullish condition and the buy points
Traders use the Zig Zag indicator for determining the trend. To understand the bullish trend there will need to find a higher peak than the previous one and the next low will be higher than the previous one.
Execution of a Buy Order in the bullish trend when price makes the next higher low than the previous low and set the Stop Loss is below the nearest low.
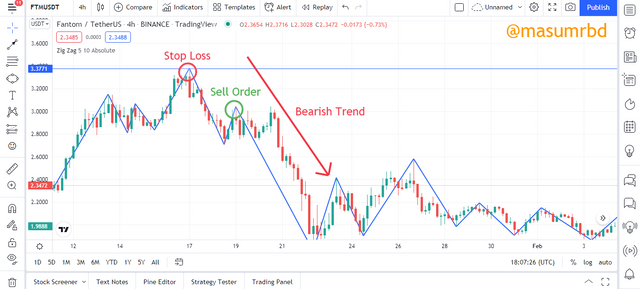
Determining bearish condition and the sell points
Traders use the Zig Zag indicator for determining the trend. To understand the bearish trend there will need to find a lower peak than the previous one and the next high will be lower than the previous one.
Execution of a Sell Order in the bearish trend, when price makes the next higher high than the previous high and set the Stop Loss, is above the nearest high.
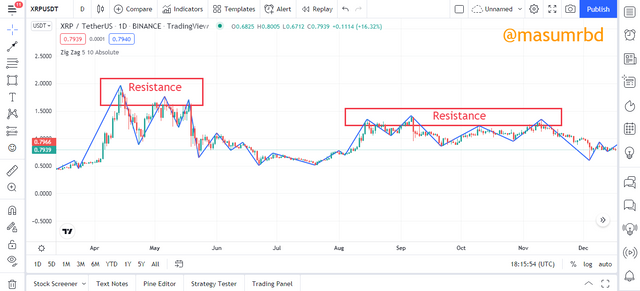
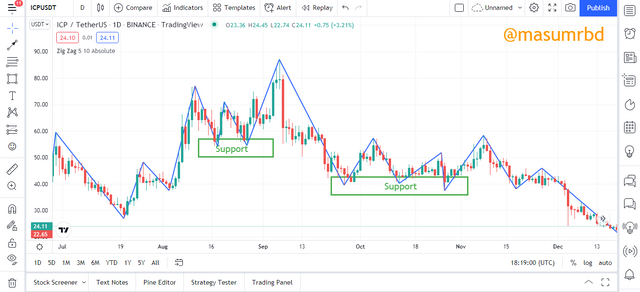
4- Explain how the Zig Zag indicator is also used to understand support/resistance levels, by analyzing its different movements.(screenshot required)
Identify Support and resistance is very important. This can be done in many ways. But the Zig Zag indicator can be used to identify the Support and Resistance easily. The horizontal highs of the Zig Zag indicator will be the resistance level and the horizontal lows will be the support level.
Here you can see in the screenshot below taken from Tradingview the horizontal highs of the Zig Zag indicator marked by rectangles indicate the resistance level.
Same as here you can see in the screenshot below taken from Tradingview the horizontal lows of the Zig Zag indicator marked by rectangles indicate the support level.
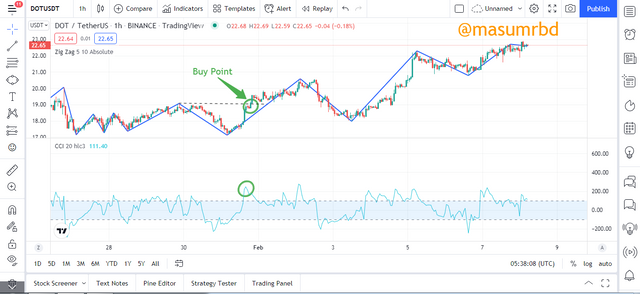
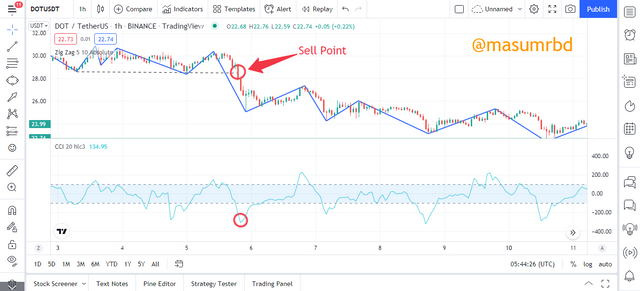
5- How can we determine different points using Zig Zag and CCI indicators in Intraday Trading Strategy? Explain this based on a clear examples. (Screenshot required)
Different points using Zig Zag and CCI indicators in Intraday Trading Strategy
I am using the ZigZag indicator with values 10,5 and the timeframe is 1H with the help of the CCI (Commodity Channel Index) indicator we could know if there is a buying or selling pressure going on market.
On the Tradingview we simply receive a Buy Signal when there is a breakout of the last maximum value of the Zig Zag and at the same time the value of the CCI (Commodity Channel Index) indicator exceeds 100. The entry value is that of a breakout of a point of the extreme value of the Zig Zag.
On the Tradingview we simply receive a Sell Signal when there is a breakout of the last minimum value of the Zig Zag and at the same time the value of the CCI (Commmodity Channel Index) indicator exceeds -100. The entry value is that of a breakout of a point of the extreme value of the Zig Zag.
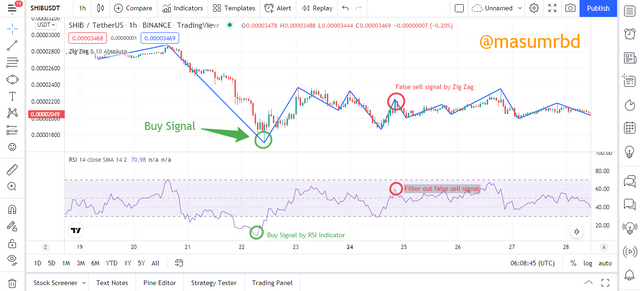
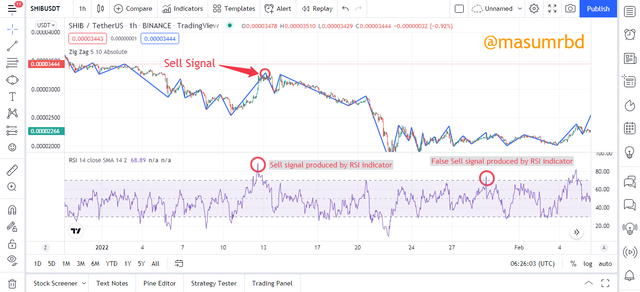
6- Is there a need to pair another indicator to make this indicator work better as a filter and help get rid of false signals? Give more than one example (indicator) to support your answer. (screenshot required)
In trading traders always use two or more indicators before trading. One is the basic indicator and another indicator gives confirmation. With Zig Zag indicator we can use a lot of indicators for better results and also filter out the false signals. I will use Zig Zag with the RSI indicator. Here we got two scenarios and also filter out false signals.
Buy Signal Zig Zag and RSI indicator
You can see in the screenshot below a buy signal formed in Zig Zag and the signal is confirmed by the RSI indicator because the oscillator is below 30. Also, there is a false signal filter out by RSI indicator a sell signal is formed in the ZIg Zag indicator. But it is easily filtered out by the RSI indicator. The RSI value does not exceed 70 hence it is a false signal by the Zig Zag indicator.
Sell Signal Zig Zag and RSI indicator
You can see in the screenshot below a sell signal formed in Zig Zag and the signal is confirmed by the RSI indicator because the oscillator is above 70. Also, there is a false signal filter out by RSI indicator a sell signal is formed in the Zig Zag indicator. But it is easily filtered out by the RSI indicator. The RSI value exceeds 70 hence but there is no bearish movement in the chart.
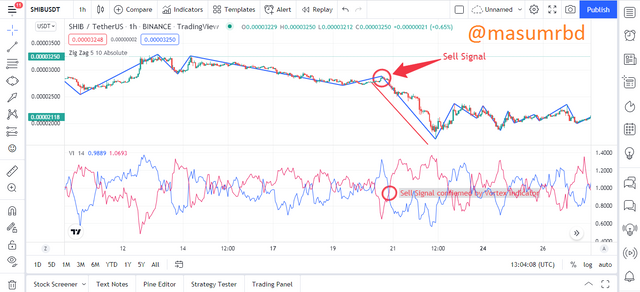
Sell Signal Zig Zag and Vortex indicator
Here you can see a Sell signal formed in the Zig Zag indicator. The signal is confirmed by another indicator named Vortex indicator. In the Vortex indicator, the red and blue line crosses each other and the red line is above the blue line hence it is a sell signal formed by the Vortex indicator.
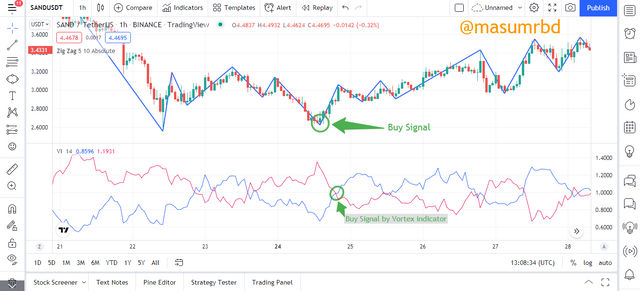
Buy Signal Zig Zag and Vortex indicator
Here you can see a Buy signal formed in the Zig Zag indicator. The signal is confirmed by another indicator named Vortex indicator. In the Vortex indicator, the red and blue line crosses each other and the blue line is above the red line hence it is a buy signal formed by the Vortex indicator.
7- List the advantages and disadvantages of the Zig Zag indicator:
List the advantages and disadvantages of the Zig Zag indicator:
| Advantages | Disadvantages |
|---|---|
| The market trend is easily identified by the Zig Zag indicator | The result from the Zig Zag indicator is sometimes a false signal. |
| The indicator uses one line and shows market trend this is good for newbie traders | A small change in the depth parameter will give you unnecessary results. |
| Efficiently work with Elliot Wave indicators | The last line is not stable and may reform again. |
| The indicator is good for higher time frames. | For lower time frames this indicator is not good. |
| The indicator is great if it can be used with another indicator like the RSI indicator | The indicator is used to analyze past price movements so this is not so reliable. |
8- Conclusion:
Conclusion
This lesson about Zig Zag indicator is very helpful and also interesting to me. Zig Zag is a technical analysis tool that ignores the small price movement in the market. It also eliminates the noise of everyday market conditions. This basic tool is great for determining the swing highs and swing lows.
The indicator reflects its past movements and does not provide buy or sell signals. The indicator indicates the swing highs and swing lows in the market. That's why the indicator is not good for any signals. But it can be used to understand a trend in the market. That helps in the integral analysis of trade. There are two parameters depth and deviation in the indicator. Traders generally customize the depth value but very carefully. Because the too low value of the depth will show numerous false microtrends and the higher value will draw unrealistic lines that will be worthless.
There is not such an indicator that gives 100% accurate results. That's why the Zig Zag indicator is not also show accurate results. So, it is wise to use this indicator with another indicator for the signal confirmation and filter out false signals and the trader will be profitable.
Best Regards,
@masumrbd
It is outstanding zig zag model explanation. Go ahead.
Thanks, brother. Keep appriciating.