Crypto Academy Season 4 | Homework and Lesson For @allbert : Trading with Strong, Weak and Gap Levels
Greetings to all the crypto academy lovers and welcome back for season 4. I also want to take this opportunity to thank professor @allbert for this wonderful, clear, and educative lesson. I will explain below how I understood the lesson.
.png)
My Introduction.
In this lesson, we shall talk about support and resistance levels, weak and strong levels, Gap levels, levels, and how to trade with these levels.
Before We go any further, let me explain my understanding of Support and Resistance levels and the difference between the two.
Support Level Explanation.
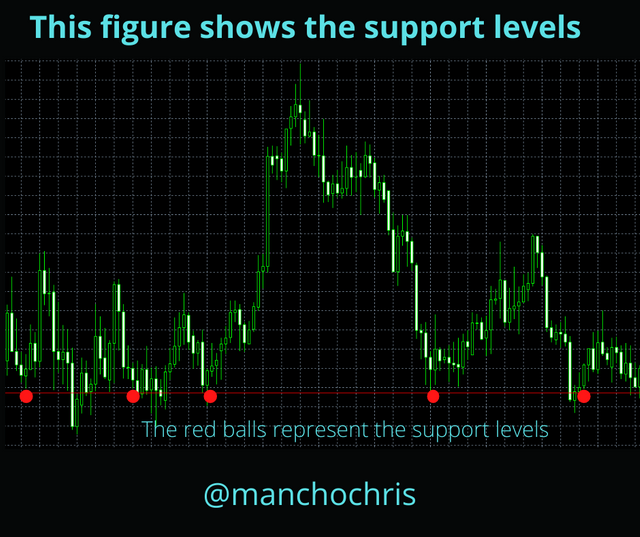
Normally when prices pause in the same area of the market three, four, five times, and more during a downtrend, this level is called Support. What this means is that there are so many buyers waiting to go long at this point.
Once a point is identified as a support level, we normally expect two things to happen. Either the price is bouncing back or the price is violating the support level and continuing down until it gets to another support level.
This also means that support can turn out to be a new resistance level and the reverse is true as we shall see when we look at resistance levels.
Let me back up my explanation with a graphical representation such that we clearly understand the support level;
Resistance Level Explanation.
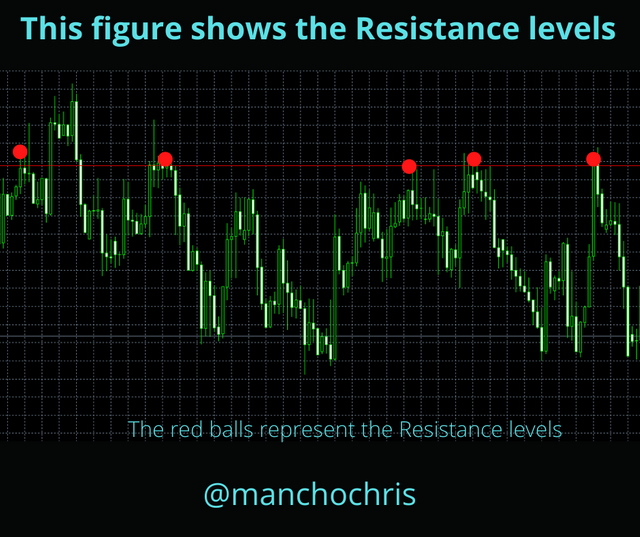
Just as the support level, when prices pause in the same area of the market for three, four, five times, and more during uptrend movement, this level is considered to be the Resistance level. What this means is that there are so many sellers waiting to go short at this point.
Similarly, once a point is identified as a resistance level, we normally expect two things to happen. One either the price is bouncing back or the price is violating the support level and hence continuing upward until it gets to another resistance level.
This also means that the resistance level can become the new support level once the price violates the resistance level and continues in the upward direction.
Let me back up my explanation with a graphical representation such that we clearly understand the Resistance level;
The difference between support and resistance is that the support level happens while the price is on a downtrend and it happens when the buyers are stronger than the sellers while resistance happens on the upward trend when the sellers waiting is stronger than the buyers.
These two zones once identified well can be good position entries in trading.
Question one:
Graphically, explain the difference between Weak and Strong Levels. (Screenshots required) Explain what happens in the market for these differences to occur.
Weak Support and resistance levels.
These are support or resistance zones or lines that are not very reliable. They tend to form and breakthrough easily.
This is represented graphically below;
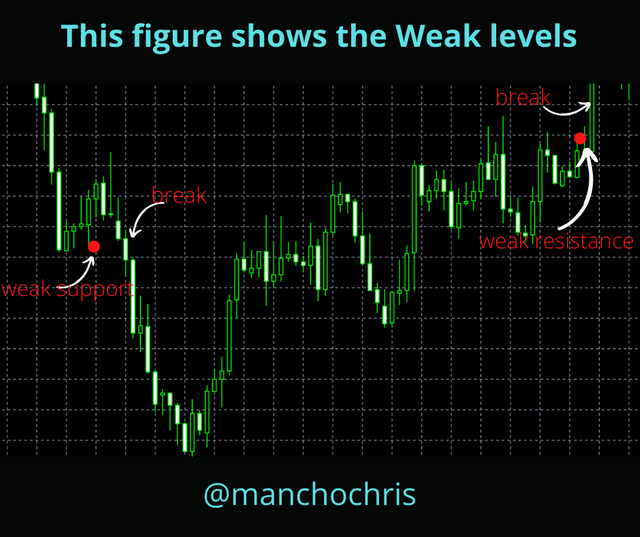
These zones are not recommended as nice entries for traders because they normally end up as traps or failed trades.
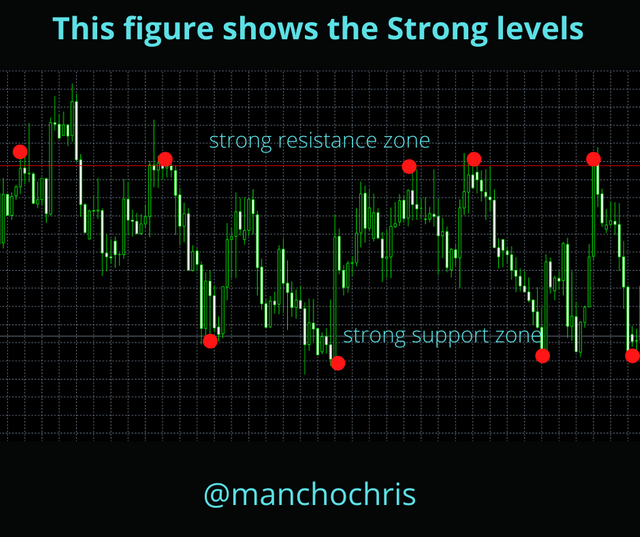
Strong Support and resistance levels.
When a zone resists a price several times, then this level is identified as a strong resistance or support depending on the trend. If it is an upward trend, then it will be a strong resistance zone and if it is a downtrend, we call it strong support.
This is represented graphically.
.png)
This zone is highly recommended for traders to preset their orders such that they are triggered as soon the price hits the resistance or support levels.
Question Two:
Explain what a Gap is. (Required Screenshots) What happens in the market to cause It.
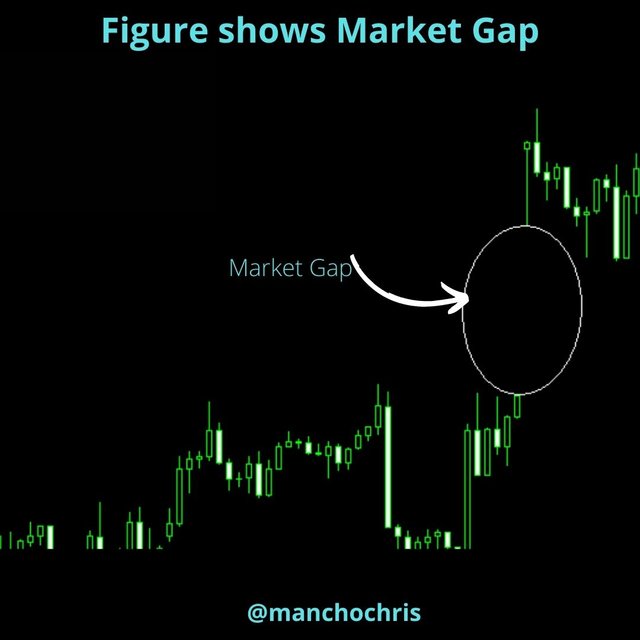
Gaps;
A 'Gap' in the market happens when the initial price is higher than the last meeting's exorbitant price, known as gapping up, or lower than the last meeting's low cost, called gapping down.
These gaps can be fundamental in trading as brokers are accepting that gaps are commonly filled very quickly.
When do Gaps occur;
At the point when financial information is delivered for the most part if it contains information that the market isn't expecting and when significant news and occasions are reported.
Gaps can give a thought of market feeling. At the point when a market holes up, that implies zero merchants were able to sell at the levels of the gap. At the point when a market gap is down, zero brokers were able to purchase at the level of the gap.
These are likewise essential to know about because it is feasible to gap past a stop arrange and get filled at a more terrible cost than your stop request.
A gap for the most part happens when there is low liquidity on the lookout. There are insufficient purchasers or merchants to exchange that currency. It might likewise happen when there is a high volume in that currency.
Question Three:
Explain the types of Gap (Screenshots required, it is not allowed to use the same images of the class).
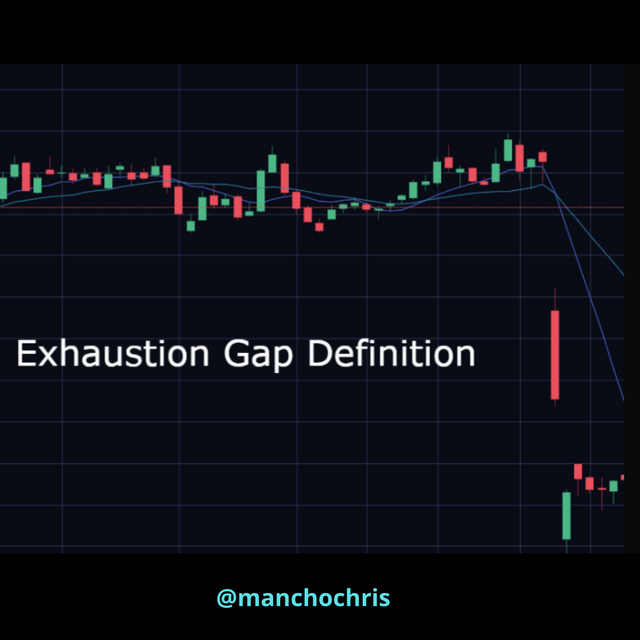
Exhaustion Gap.
This gap educates us regarding the finish of a pattern. We can discover the distinction between the runaway gap and exhaustion gap just during the inversion day when the exhaustion gap is filled.
At the point when the fatigue gap is shaped with a huge volume then there is a greater chance that the market is exhaust and the current pattern design is brought to a sudden stop and that stop is trailed by a recent fad design ordinarily. These sorts of gaps(Exhaustion Gaps) are not viewed as significant pattern inversions.
.png)
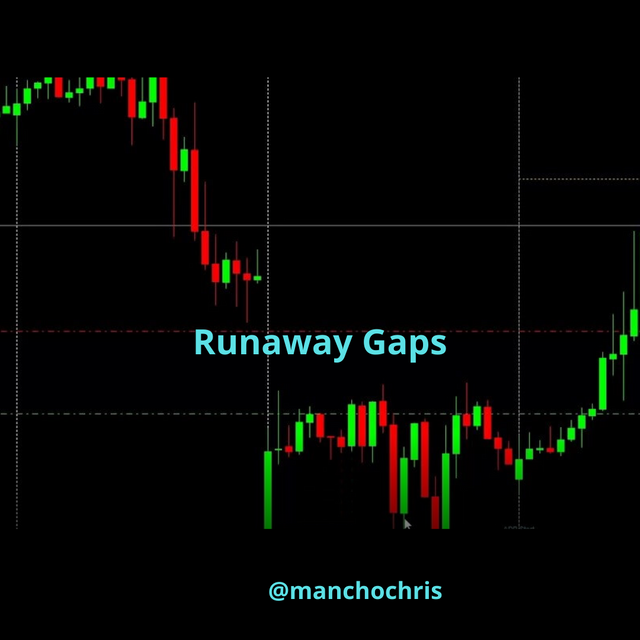
Runaway /Continuation Gaps:
Runaway gaps are likewise alluded to as estimating gaps. Runaway gaps in an upswing address brokers who didn't get in during the start of the upturn and keeping in mind that sitting tight at a retracement in cost, they concluded it was not going to occur.
There is expanded purchasing interest out of nowhere. This kind of rampant hole addresses a near alarm state in dealers.
Runaway gaps can likewise be brought about by significant news occasions which might cause new interest in the stock.
In a downtrend, runaway addresses an expansion in the liquidation of the stock by the purchasers who are remaining uninvolved.
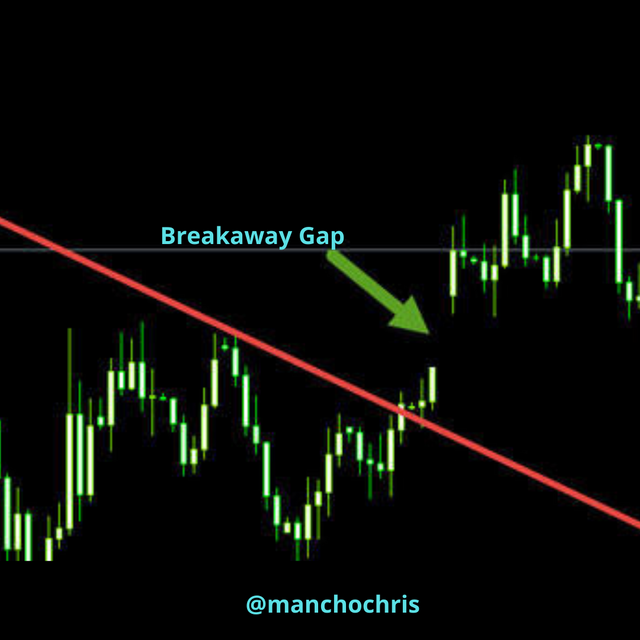
Breakaway Gaps:
The breakaway hole generally doesn't get filled at first. A breakaway hole happens when the cost of the stock holes over a help or opposition level. It resembles a breakout design, however here the genuine breakout occurs as a hole.
This sort of hole signals solid energy and value continues to drift after a breakaway gap.
Besides, the bigger the breakaway gap, the more grounded the following flame after the gap, and the more grounded the common pattern will be.
Common Gaps:
Common gaps are additionally now and then alluded to as trading gaps. This gap happens in anxious business sectors and is by and large shut inside a couple of days. They can be brought about by a currency going ex-profit when the volume is low.
A typical gap shows up in an exchanging range and supports the clear absence of interest in the stock around then.
Thinking about these kinds of gaps is acceptable, yet it's generally far-fetched that they will create exchanging openings.
Question Four
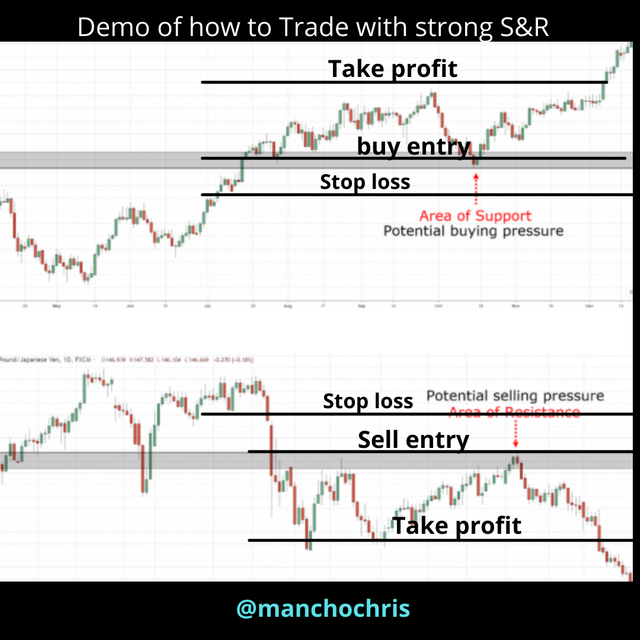
Through a Demo account, perform the (buy/sell) through Strong Supports and resistances. Explain the procedure (Required Screenshots).
I will take this chance to show the entry points while using the strong support and resistance strategy. What fails most traders is discipline and failure to know when are where enter a trade and then when to move out of a trade.
The figure below describes these situations.
.png)
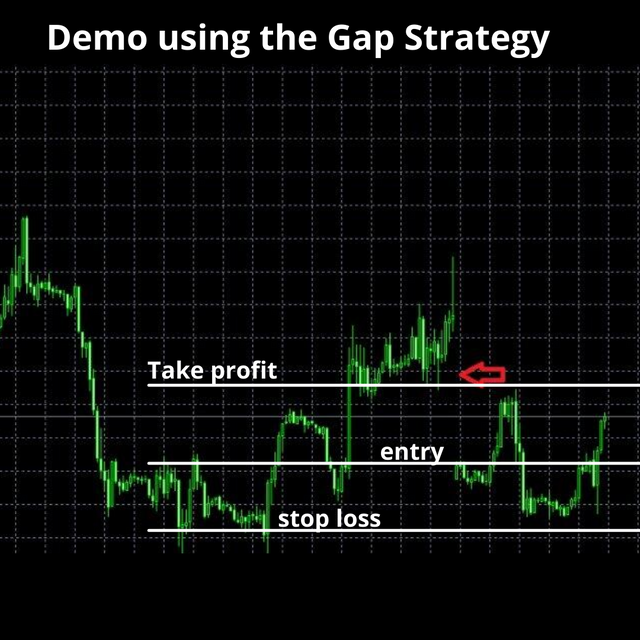
Question Five
Through a Demo account, perform the (buy/sell) through Gaps levels. Explain the procedure (Required Screenshots)
Again I will take this chance to show the entry points while using the strong gap strategy. We all want to make profits at the end of the day but what fails most us is discipline and failure to know when are where enter a trade and then when to move out of a trade.
The figure below describes these situations.
My Conclusion
In this illustration, we saw the Strong levels and the Gap variations. The vast majority of us realize how to utilize Strong help and opposition focuses in our exchanges, however, I think I took in a decent arrangement about Gap exchanging this course.
In this illustration, I perceived how basic these exchanging techniques are and that they are so difficult to see. Perhaps I had the option to learn and apply this illustration effectively because of the talk of the Professor. On account of educator @allbert hence.
On account of every individual who read my post. I wish you each of the sounds an excellent day.
You have been curated by @yohan2on, a country representative (Uganda). We are curating using the steemcurator04 curator account to support steemians in Africa.
Keep creating good content on Steemit.
Always follow @ steemitblog for updates on steemit