Crypto Academy Season 3 Beginners’ Level - Homework Post for WEEK 7: [Analysis and Trading with the indicators "Stochastic Oscillator +" Parabolic Sar "] by @manchochris for Professor lenonmc21
.png)
Define in your own words what is the Stochastic Oscillator?
Stochastic Oscillator is one of the best indicators used to analyze trading charts. It is used by many traders to avoid trade losses. This oscillator was first introduced by George Lane. The idea was to enable traders to use this indicator even without any addition of any other indicator. However, since knowledge never ends it means that if we accompany this oscillator with other indicators we can actually limit our chances of losing our assets while trading.
The other thing to note is how this indicator works, it basically works in a linear manner using two lines including "%K" and "%D". Once you know how these lines are used, you are able to sketch a signal by using this indicator. With this you will know when to enter the trade and when to move out with a profit. This helps you set high probability trades which are more likely to succeed.
Ideally when the "%K" line crosses the "%D" line and proceeds up, this declares an upward movement/trend of the market price which helps know where to trigger your trade.
Similarly when the "%K" line crosses the "%D" line and deteriorates down, this simply means the market direction is being redirected in the downward trend. At this moment you are most likely to go short.
Explain and define all components of the stochastic oscillator (% k line,% D line + overbought and oversold limits).
The Stochastic indicator by nature looks at a comparison between the deviation of the current point with highest and lowest point in a specified and known period of time.
This is how the %K line is calculated.
%K = 100*((current price point– lowest price point) / highest price point – lowest price point))
The behavior of the %K line is highly considered while making trading decisions. The %K is also known as the major stochastic indicator because it determines the direction of the market price.
For example if the "% K" line goes above the %D line, one is confident to go long because at this point we are confident that prices are going up unless otherwise. In the same way if the "% K" line drops spontaneously below the %D line, we can confidently go short because at this point we know the prices have been rejected and in short the sellers have more momentum than the buyers.
Let us now look at the % D Line :-
It is very slow and that is why it is known as the slow line of the Stochastic Oscillator. The %D line is like the moving average line of %K line and makes signal identification much easier. This moving average can be clearly seen through MetaTrader 4 charts.
Overbought & Oversold limits
I Briefly will explain overbought when it comes to Stochastic Oscillator indicator as the high range of over 80 readings out of the 100 which is the highest reading. Oversold will then be the lowest range between zero and 20.
We normally witness bullish prices once the prices move above the overbought level.
In the same way, we witness bear prices once the price moves below the oversold.
Briefly describe at least 2 ways to use the Stochastic Oscillator in a trade.
To identify when to enter a trade
The hardest thing when it comes to trading is to identify when to enter a trade. In Fact many people lose money because they do not know when to trigger their trades. But if you have the knowledge of the stochastic Oscillator, you know when to enter and when to go long and short.
For example you can decide to wait and only enter when the %K line crosses above the %D line.
To know when to move out of a trade.
The other big reason as to why many people have many losing trades is because they do not base their decision to end a trade on any information. The stochastic Oscillator gives you an overview on when you can come out of a running trade.
Define in your own words what is Parabolic Sar?
Years ago, J. Welles Wilder Jr. came up with the Parabolic sar indicator also known as the PSAR. This indicator is more of stop and reverse. It is mostly used by traders who trade according to technical analysis. This indicator looks at already existing trends. This indicator is very useful in giving entry and exit points of a trade.
PRACTICE ( ONLY USE YOUR ONE IMAGES)
It shows a step by step on how to add the Stochastic Oscillator to the chart (Indicating the% k Line and the% D Line, the overbought and oversold zone.
We are going to use trading view and I will take you through step by step on how to the stochastic oscillator to the chart.
step 1
Go to trading view platform and create an account. If you have one simply login.
Then click on Chats as showed in the screenshot below;
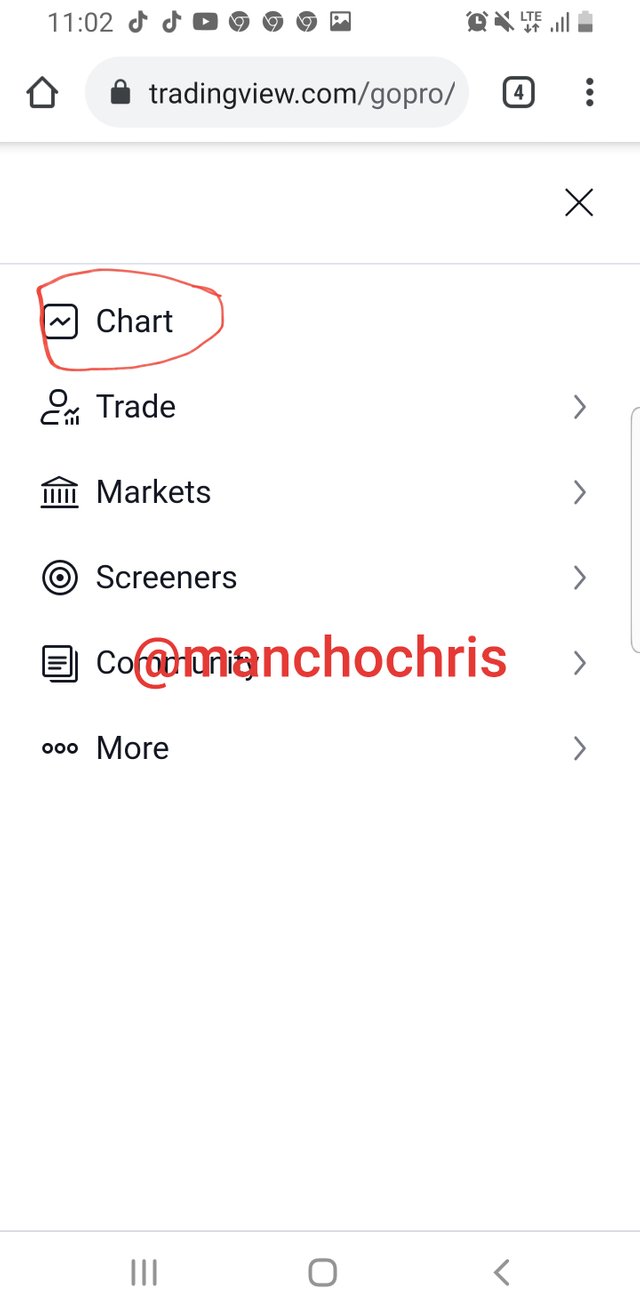
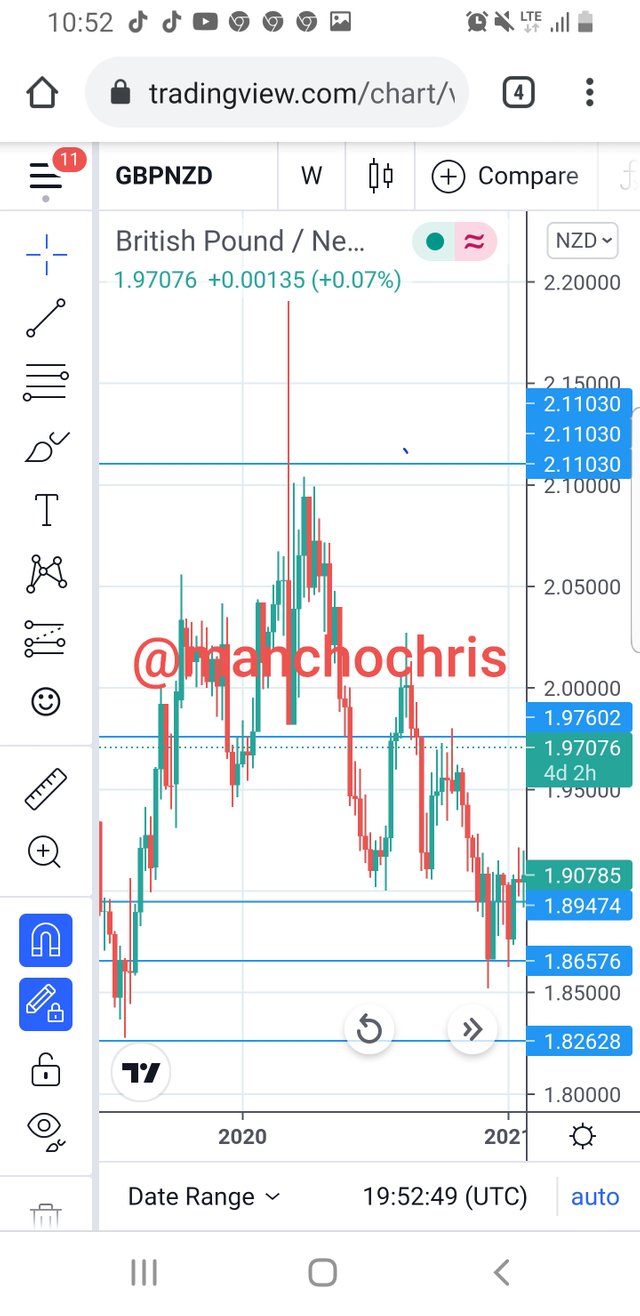
Step 2
This will open for you another page which will look like this;
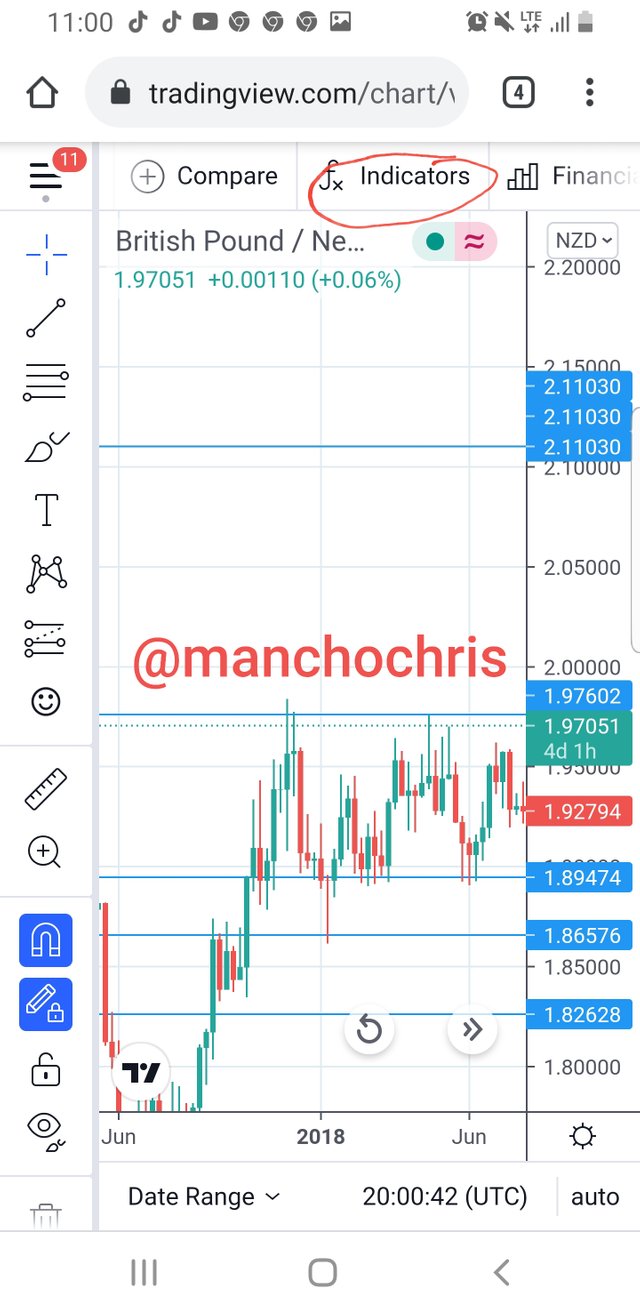
step 3
Then scroll to the right and click on Fx indicator as shown below;
step 4
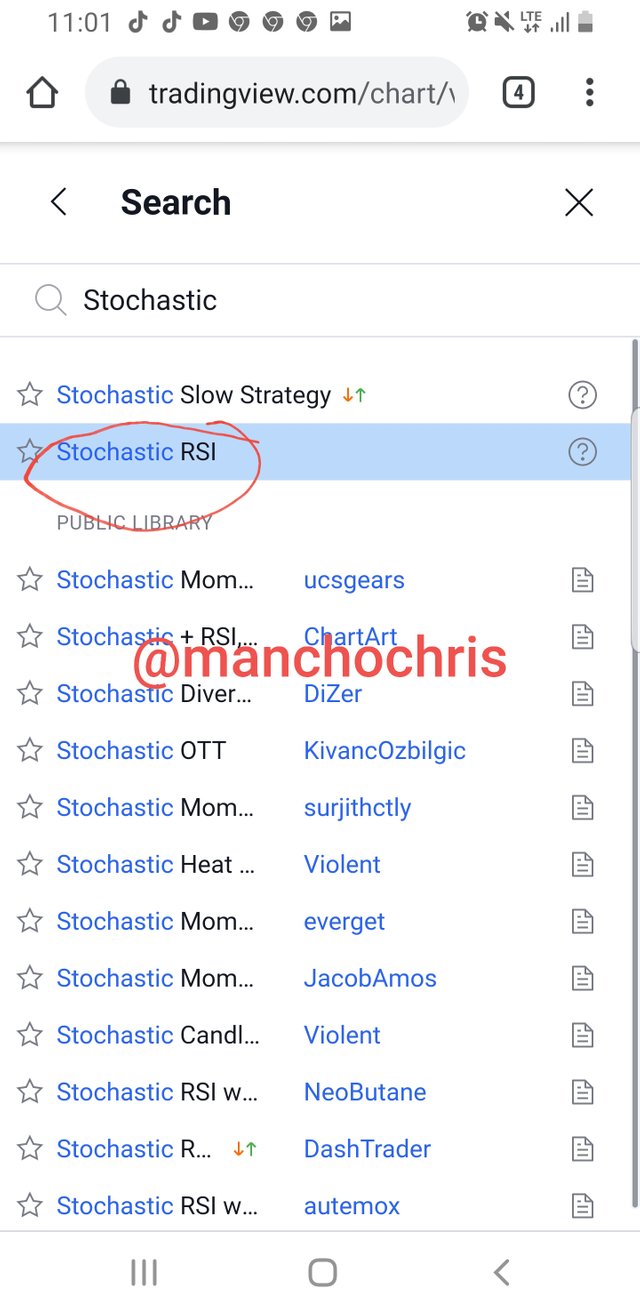
This will open a new page with a search where you will type the stochastic oscillator. Below is how the page looks like;
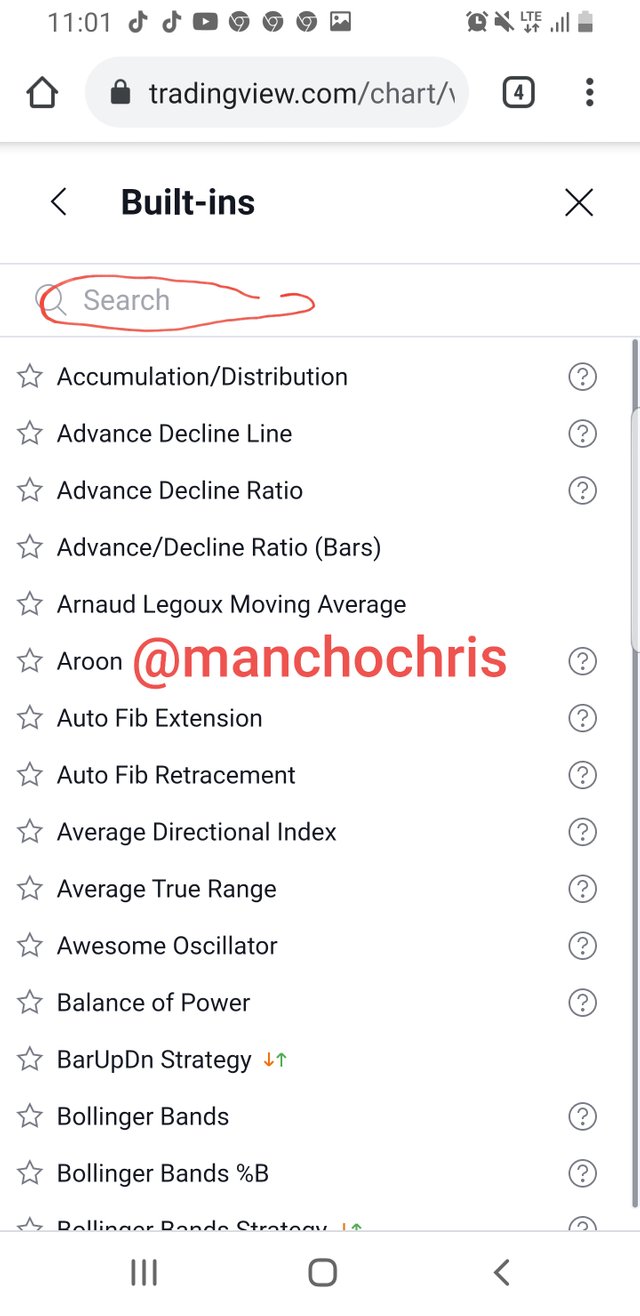
step 5
Now in the search type stochastic and it will return a list of indicators. Then select stochastic RSI. Below is how the page looks like;
step 6
After click on the Stochastic RSI it will add the indicator. So now when you go back to the chat you will be able to see the indictor on your chat. Below is how the indicator looks like;
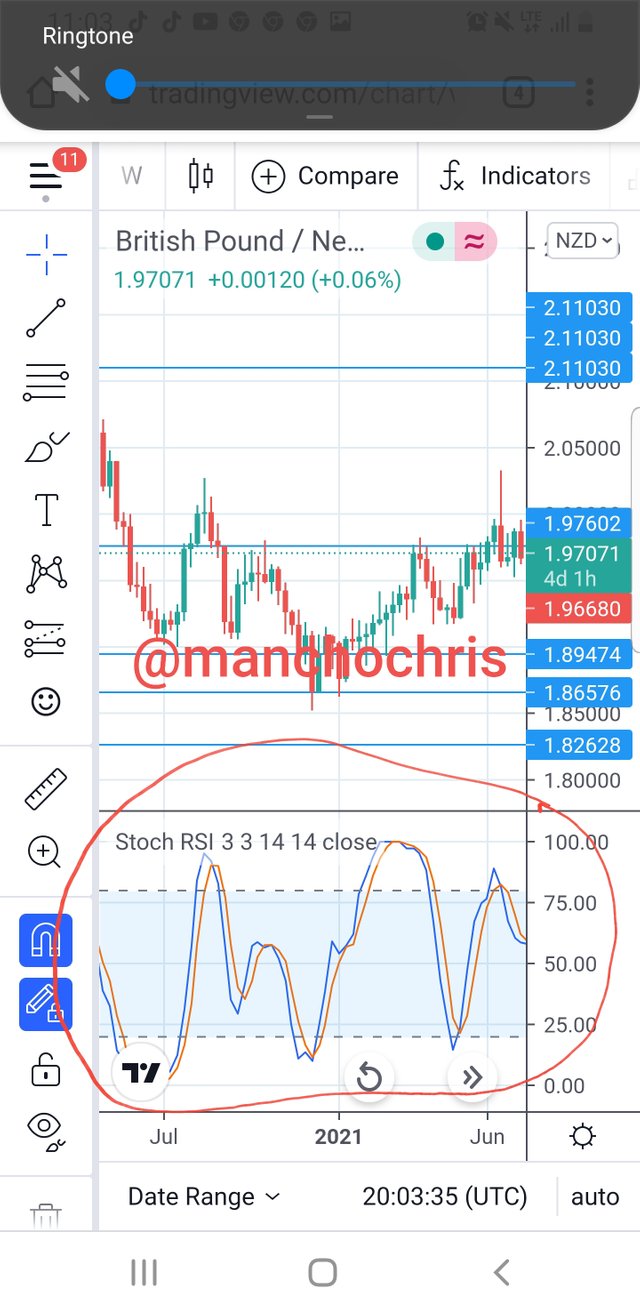
The blue line is the %K which is also called the faster Stochastic oscillator indicator and the red line is the %D a screenshot so known as the slow Stochastic oscillator indicator.
The cross above the 80 Overbought level signifies a reversal in the market while the cross below the 20 oversold level calls for a buy signal.
Show step by step how to add Parabolic Sar to the chart and how it looks in an uptrend and in a downtrend
step 1
Go to trading view platform and create an account. If you have one simply login.
Then click on Chats as showed in the screenshot below;
Step 2
This will open for you another page which will look like this;
step 3
Then scroll to the right and click on Fx indicator as shown below;
step 4
This will open a new page with a search where you will type the Parabolic Sar. Below is how the page looks like;
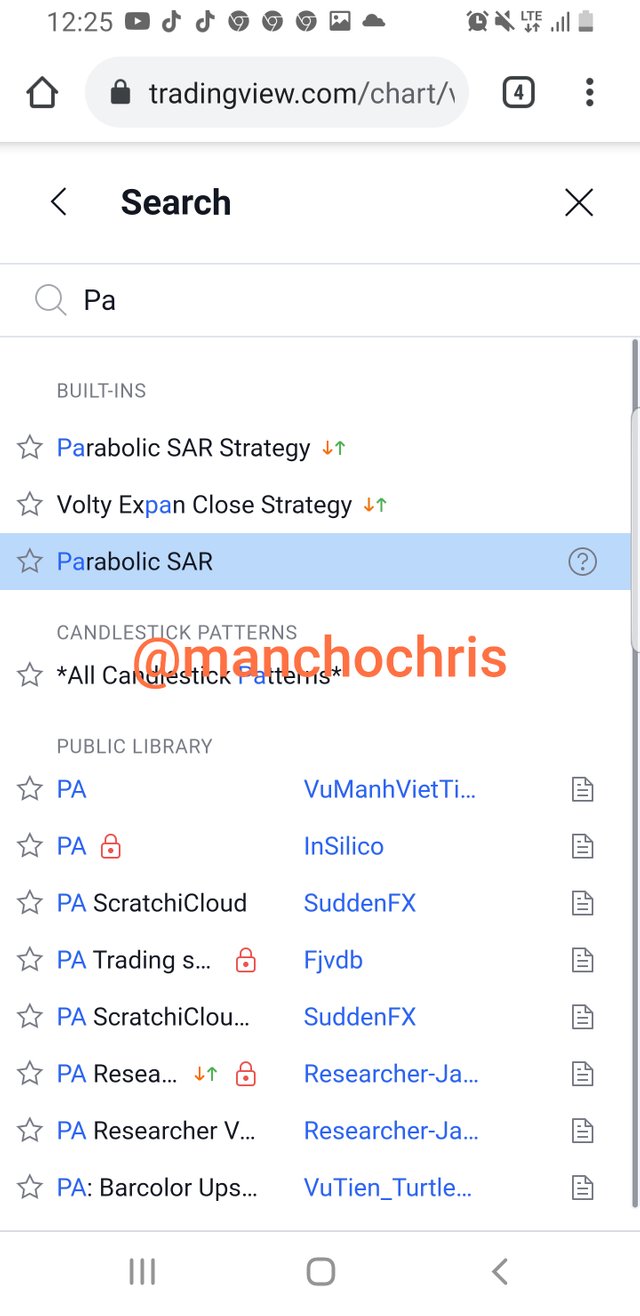
step 5
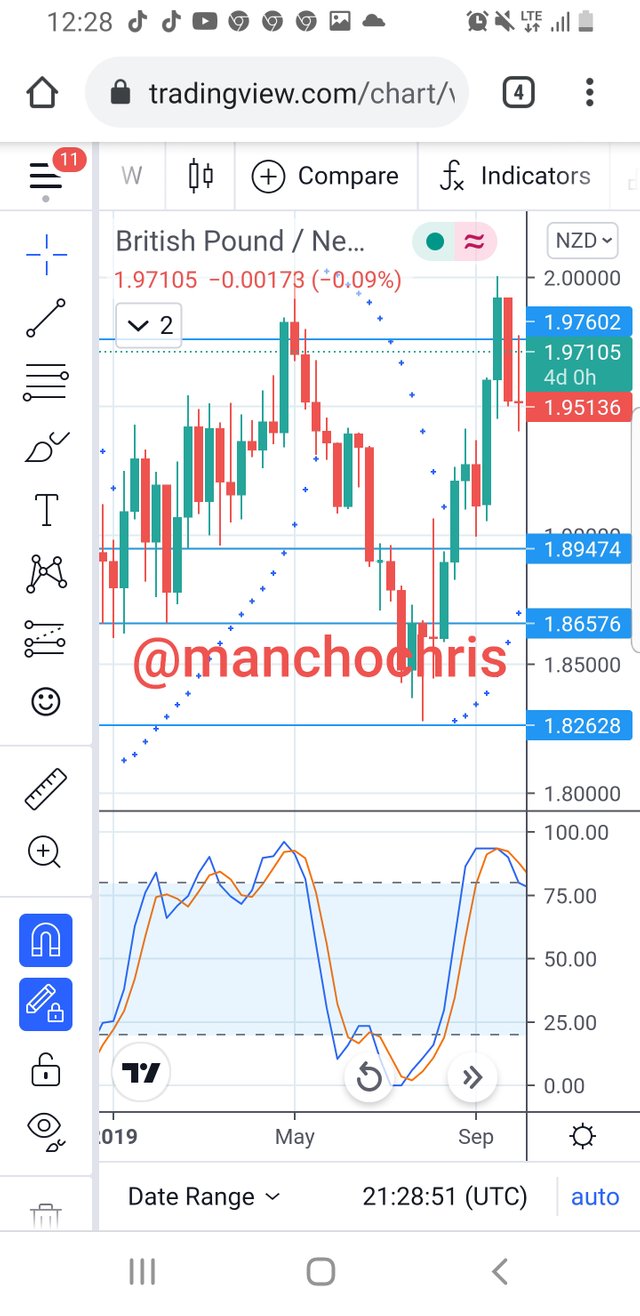
Click on Parabolic Sar, this will add the indicator to the chat. Now when you go back to the chat, this how the indicator looks like;
Conclusion.
In my Conclusion, i strongly believe that the Stochastic oscillator indicator is very important when it comes to crypto trading and forex. Also this indicator at times gives false signals, it is still one of the most vital indicators in world.
The Parabolic indicator on the other hand is unique and simple to use when it comes to identify signals involving stop and reversal positions. It is a wonderful indicator as well.
Finally, a combination of these two sognals can provide powerful and high probabilty signals.
Thank you professor for your lesson. This has been so educative.
You have been curated by @yohan2on, a country representative (Uganda). We are curating using the steemcurator04 curator account to support steemians in Africa.
Keep creating good content on Steemit.
Always follow @ steemitblog for updates on steemit
Thanks @yohan2on and steemcurator04 for the support.