Crypto Academy Week 4 Homework Post for @stream4u - Support & Resistance | Technical Indicators | TradingView | 200 Moving Average
Good Day Steemit Crypto Academy!
Today, we are discussing a few topics for the homework task posted by @stream4u. The first one will be about support and resistance. Next are technical indicators. Third is we'll discuss TradingView. Lastly, we'll tackle 200 moving average.
In today's article, we will be discussing a lot of things crypto. We're gonna start it off with one of the biggest factors why cryptocurrency prices are either staying afloat or going to the moon! We're talking about buying pressure and how it forms what we call a "Support" price.
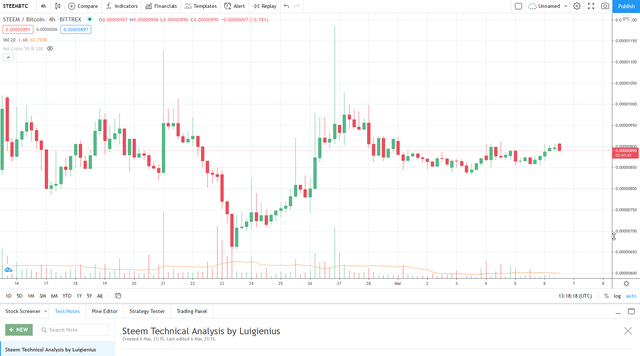

In cryptocurrency trading, buying and selling units happens really fast, 24/7, and sometimes with lots of volume. The act of buying a crypto will push the prices up and selling it will push the prices down because of spread. Both these actions have a certain pressure on how the trend goes.
Support is also called the floor price. This happens when there's a lot of buy orders on this certain price that people selling cannot put that much pressure onto it, that they cannot break through. The opposite, is called resistance on the other hand.
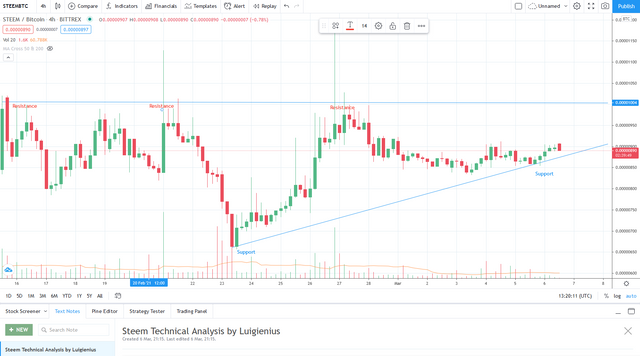

Now, not everything is eternal and support lines and also resistance lines can be broken through if the contrary exerts more pressure. There's this reversal that happens when this situation arise. This will somehow turn your previous support points into resistance points, or your resistance points to support points.
As you can see on this sample with a diagonal line added. This line deserves as a set of support and resistance points depending on how the market is going. They're on the same path but the blue indicators are where it acts as a support and the red indicators is where it acts as a resistance.

Both the support and resistance lines can be used as trading signals to when you can buy or sell a cryptocurrency. In the example above. We drew a straight line for the resistance and a diagonal line going up for the support. The instances where the candles touch the lines are your buying and selling points. Red indicators for selling, and blue for buying.

Technical indicators are tools or features that traders use to analyze information before they execute or set up a trade. They are based on numerical data that is present to the public. There are numerous indicators that you can use. Sometimes you can use them alone, sometimes you can use them together too.

Lagging indicators are those that use the past information to confirm the trend of the price, if it's going bullish or bearish. On the contrary, leading indicators are used to predict possible price and trend outcomes.
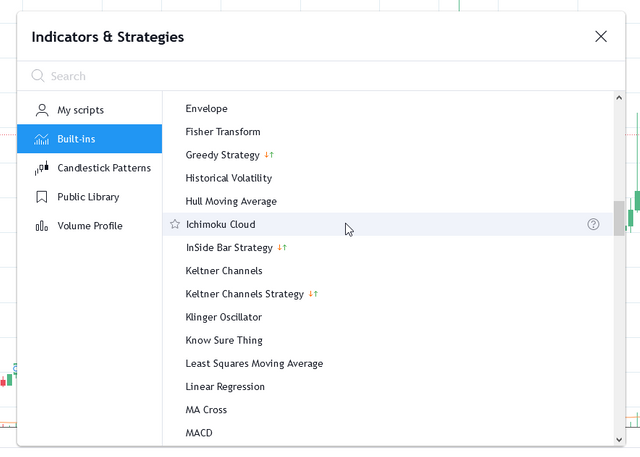
For this example, we'll be discussing a leading indicator called an Ichimoku Cloud:

It's exact name is "Ichimoku Kinko Hyo". It might look very complex especially for newbies in the cryptocurrency trading arena. However once you already know what it's for, it can make your decision making for trades a bit faster. It's translated to the “one look equilibrium chart” and was designed specifically to enable faster & easier decision making for trades.
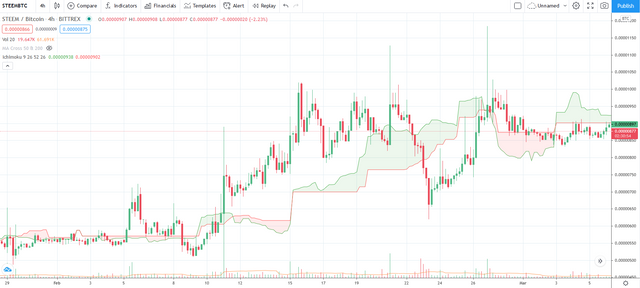
What you see here is a very basic Ichimoku cloud. On this setup I only made use of the Kumo Cloud or the bordered red and green indicator you see. It's self-explanatory really, the green ones says it's bullish and the red one says it's bearish.
Here's a look at an example of a bullish Kumo Cloud:
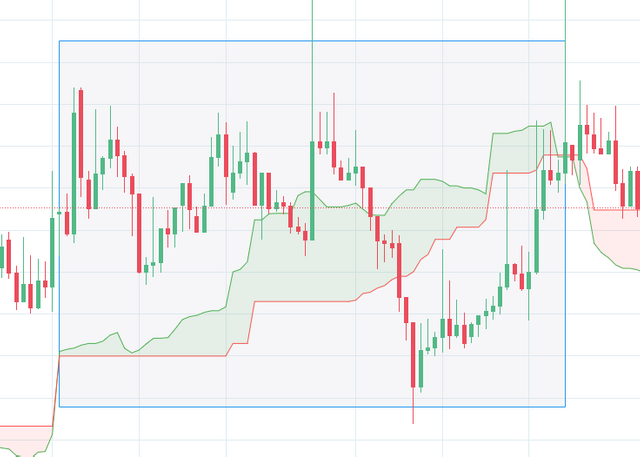
And here's a look at a bearish Kumo Cloud:
However, using the full Ichimoku Cloud technical indicator may be a bit more complex, since on top of that cloud, there are 3 other line graphs that are introduced on it.
For a strong Ichimoku cloud bullish signal, everything must occur above the filled Kumo cloud:
- The price action must remain above the Kumo cloud.
- The Chinkou line must stay above the kumo cloud & Tenken should be crossing Kinjun also above the Kumo.
- Tenken should be crossing upside - if this cross occurs inside of the Kumo then that's just a weak bullish signal.
For a strong Ichimoku cloud bearish signal, it's basically the reverse of what's stated above:
- The price action should occur below the Kumo cloud.
- The Tenken and Kinjun crossing and the lagging line Chinkou should be below Kumo.
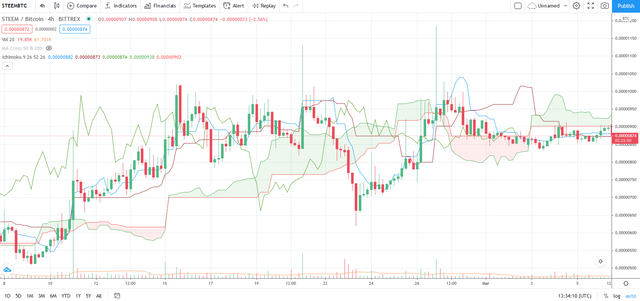
Here's what a full Ichimoku Cloud indicator looks like:

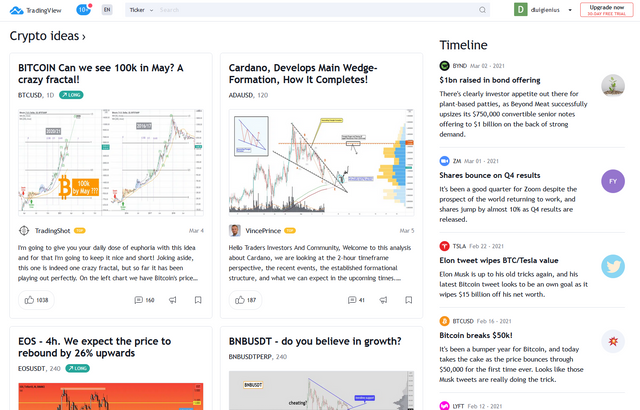
All of the charts that you saw above are from TradingView. It is currently one of the leading browser-based charting platforms for different financial assets. This platform has a wide selection of customization and features available to its users to enable a smoother TA experience.
On top of that, TradingView is also a social media platform for traders. Where people have the ability to join discussions, follow other traders, create their own chart and share it; and a lot more features for traders.
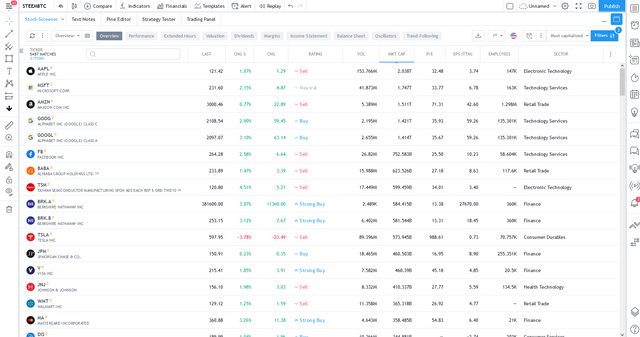
There's a lot you can do inside this platform and it's not only limited to cryptocurrencies, they also cover other financial assets like stocks and foreign exchanges.

The 200 moving average technical indicator is a simple but useful technical analysis tool to check the trend of a certain asset, if it's bullish or bearish. It's a line graph of the closing price of the past 200 days. Now, there are different types of moving averages (weighted, exponential, etc), that can be more fine-tuned depending on what you want to look at on your graphs.
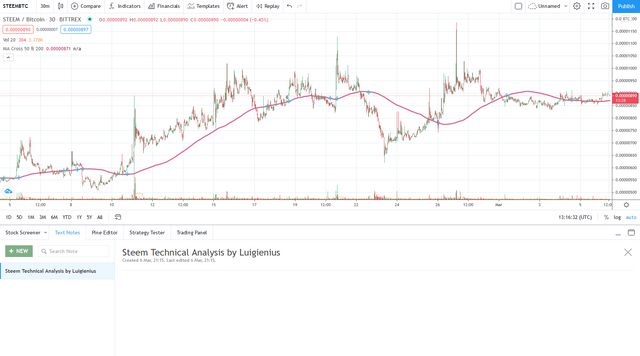
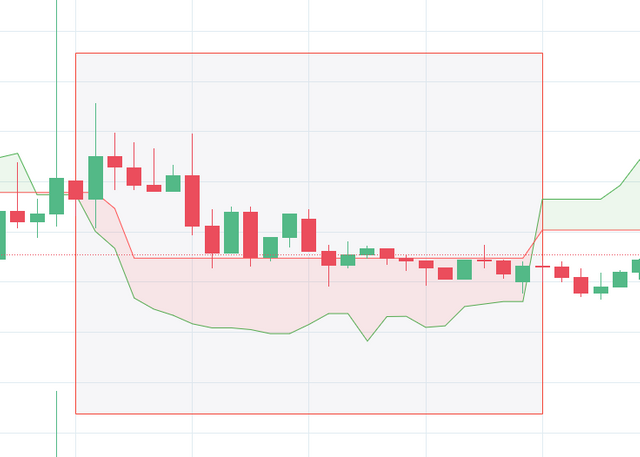
We're still using TradingView for this section of the article and we're using Steem as an example. For this graph, you can clearly see both a bearish market and a bullish market and how it looks with the 200 moving average on the graph.
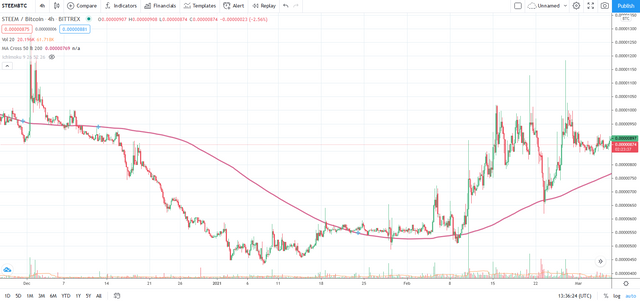
It's actually very simple. If the 200 moving average line is under the candles on the chart then this is a bullish market. On the contrary, if the moving average line is above the candles on the chart, that is a signal for a bearish market.
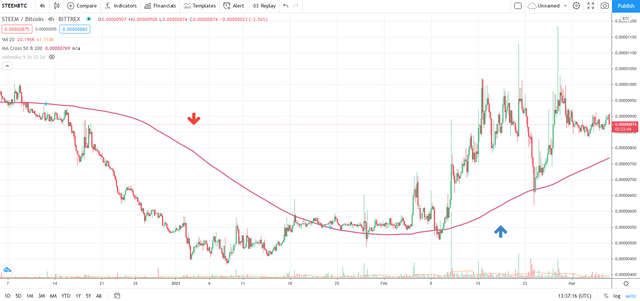

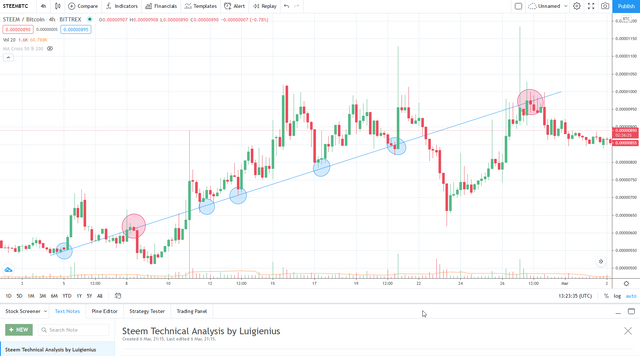
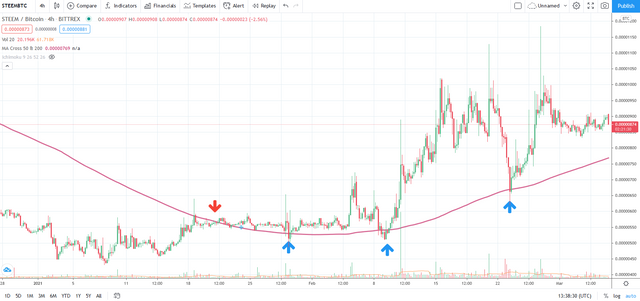
Using the 200 moving average line's interaction with the candles, you can check when you can do buys and sells for your cryptocurrencies. Then red arrow here indicates a reversal, where the MA line crosses the candles completely and changes it's position (from above the candles to under the candles). The blue arrows are buy signals. Buy signals occur when the MA line is generally under the candles on a bullish market and the candles just 'kisses' the line but never crosses it.
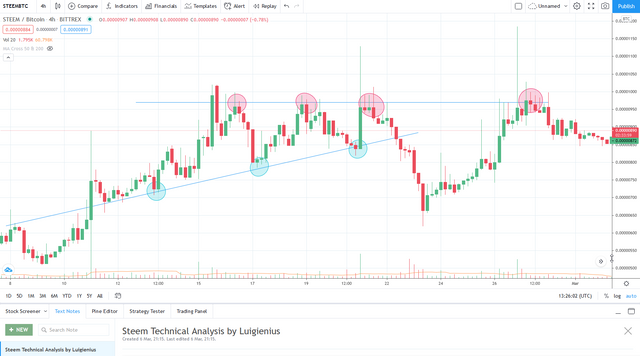
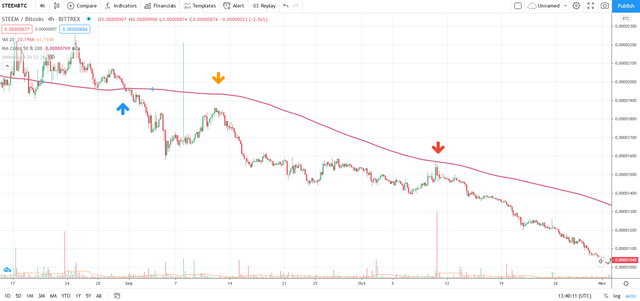
The next sample graph shows another reversal, this time from bullish to bearish. Notice how the MA line was below the candles before the reversal and is now above the candles after the reversal. The blue arrow indicates when the crossing happened. The orange one is almost a selling signal - it is however the candle did not kiss the MA line so it's not a strong signal. The red one though, is what we call a sell point, since the candles and line touched each other.
There are other points on those previous graphs that I have not plotted but clearly shows how the 200 moving average confirms when the price movement is bullish or bearish, you just have to look. A keen eye and a solid technical analysis will surely result to more successful trades!
Hi @luigienius
Thank you for joining Steemit Crypto Academy and participated in the Homework Task 4.
Your Homework task 4 verification has been done by @Stream4u.
Thank You.
@stream4u
Crypto Professors : Steemit Crypto Academy
Thanks a lot I will take into heart your suggestion!