SEC S18-W5 || Mastering Trading with Stochastics and Parabolic SAR
Hello all my friends...

The theme raised this time is very interesting, namely Mastering Trading with Stochastics and Parabolic SAR. This is Season 18 and week 5 of the Steemit Engagement Challenge. We need to know this because it can help us in trading and analyzing trend directions so as to minimize losses incurred in the world of trading. I will try to explain them one by one.
Explain the components of the Stochastic Oscillator. How does it help in identifying overbought and oversold conditions in the market?
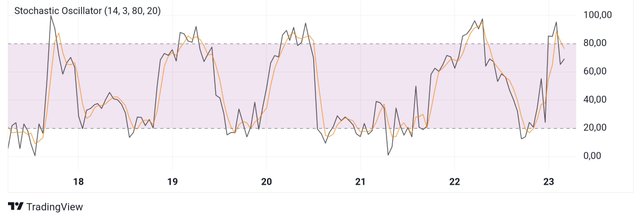
Image source
Traders need various indicators in trading and one of the most popular indicators that we know is the stochastic oscillator indicator. The stochastic oscillator is an indicator that functions to show buying and selling signals through two crossing lines which act as a momentum indicator by comparing a closing price with the price range that exists during a certain time frame.
The Stochastic Oscillator indicator is a popular technical indicator for:
- shows the last closing/close price,
- generate an overbought/overbought signal or an oversold/oversold signal,
- helps predict long-term trends for optimal profits.
The accuracy of the oscillator is influenced by the time frame selected. The Stochastic Oscillator indicator has two components, namely; complex and multipurpose. Both play a role in showing several signaling signals for various conditions that may occur. These signals include:
- overbought-oversold
- divergence
- trading entries
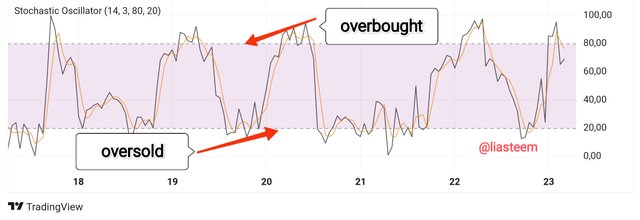
Image source
This overbought-oversold signal has two extreme levels, namely levels 80 and 20, where levels 80 and above indicate overbought conditions, and levels 20 and below indicate oversold conditions. This function cannot be used as a benchmark for the right time to make an entry because the value is not always stable.
Divergence signal to make an entry, traders need to pay attention to this signal where traders will find the %K and %D lines crossing each other. A buy signal is detected when the %K line crosses the %D line, with the %K line positioning from top to bottom as in the illustration below.
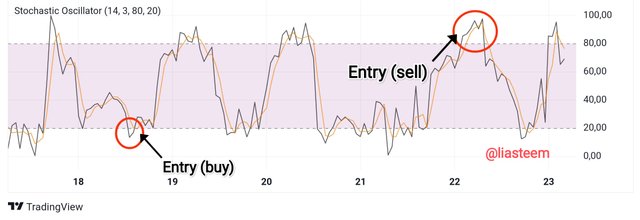
Image source
Trading entry signals also provide an overview of the differences between price movements and indicators. This difference is the basis for projections of whether the price trend will continue or reverse. The characteristics of this function are visible in a set of signal lines at peak/high and base/low. Note that when high and low positions decline, momentum is weakening and when high and low positions increase, momentum is strengthening.
Describe the Parabolic SAR indicator and its application in identifying the trend direction. How is it interpreted differently in an uptrend compared to a downtrend?
The parabolic SAR indicator is an indicator developed by J. Wells Wilder. He lived between June 11, 1935 – April 18, 2021 and was an American mechanical engineer. However, he is best known for his work in technical analysis which makes him the father of several technical indicators that are now considered core principles of technical analysis software used by traders to determine trend direction and potential price reversals.
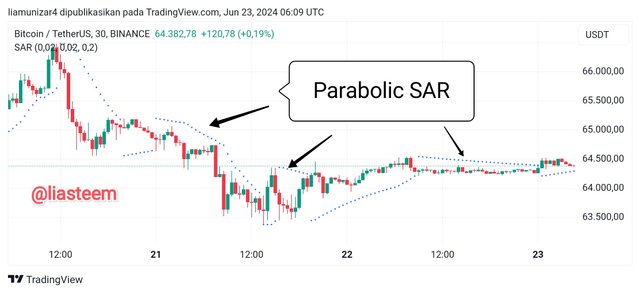
Image source
The parabolic SAR indicator uses a trailing stop and reverse method called "SAR", or stop and reverse, to identify exit and entry pointsappropriate. Traders also call this indicator the parabolic stop and reverse.
The parabolic SAR indicator appears on charts as a series of dots, either above or below the price of an asset, depending on the direction of price movement. A dot is placed below the price when the trend is up, and above the price when the trend is down.
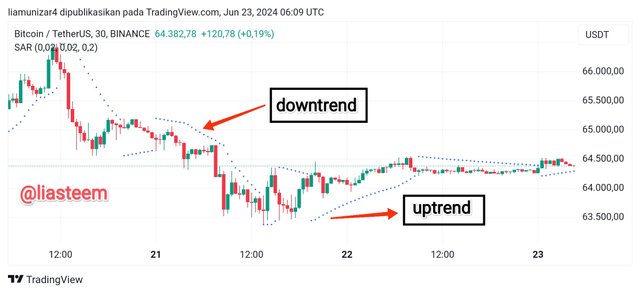
Image source
The parabolic indicator generates a buy or sell signal when the dot position moves from one side of the asset price to the other. For example, a buy signal occurs when the dots move from above the price to below the price, while a sell signal occurs when the dots move from below the price to above the price.
Traders also use Parabolic SAR points to set trailing stop loss orders. For example, if the price is rising, and the Parabolic SAR is also rising, then the Parabolic SAR can be used as a possible exit if it is long. If the price falls below the Parabolic SAR, exit the long trade.
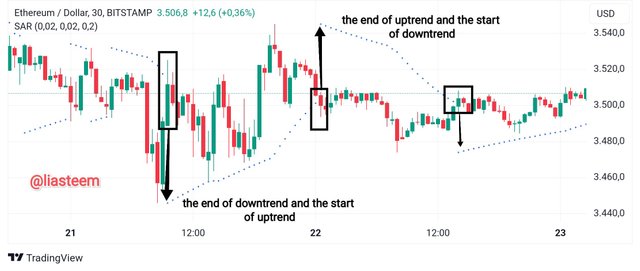
Image source
Parabolic SAR moves regardless of whether the price moves. This means that if the price initially rises, but then moves sideways, then the Parabolic SAR will still rise even though the price moves sideways. A reversal signal will be generated at some point, even if the price has not yet fallen. Parabolic SAR only needs to chase price to generate a reversal signal. Therefore, a reversal signal on the indicator does not necessarily mean that the price is reversing.
The parabolic indicator generates a new signal every time it moves to the opposite side of the price of an asset. This ensures a position in the market always, which makes this indicator attractive for active traders. This indicator works most effectively in trending markets where large price movements allow traders to make large profits. When the price of a security is bound to a certain range, the indicator will continue to reverse direction, resulting in several trades with low profits or losses.
How can the combination of the Stochastic Oscillator and Parabolic SAR be used to create a robust trading strategy? Provide a detailed explanation.
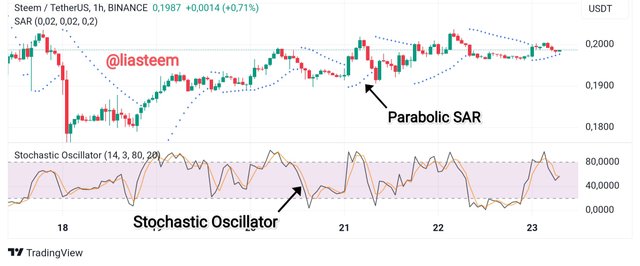
Image source
As we know, just one indicator can really help us in analyzing trend direction. And this time, if these two indicators are combined, it will become an extraordinary "combat tool", and will even prevent us from experiencing some big risks even when there is a sudden reversal of the trend direction or there is a falsification of the signal given.
You need to know that none of the indicators circulating throughout the world are truly 100% accurate. Indicators will never provide indications that are always precise and accurate. Indicators will never be perfect in predicting future price movements. However, with indicators, traders have clues to find the right transactions so that what the trader wants can be achieved.
Before starting trading using these two indicators, it is very important to understand the characteristics of each indicator in detail. This allows traders to optimize the use of these two indicators, and obtain maximum trading results. Parabolic SAR to detect market trends while the Stochastic Oscillator indicator is at levels and lines 50-80 (considered bullish and overbought) / 50-20 (considered bearish and oversold).
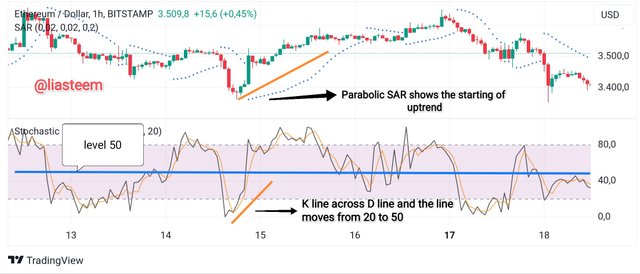
Image source
In the chart above, we can see that the two Stochastic Oscillator and Parabolic SAR indicators are used simultaneously and show how the trend is going. On the Stochastic Oscillator indicator, the K line crosses the D line and level 20 moves up to level 50, while the Parabolic SAR indicator shows a dot below the candle which indicates that the trend is upand this shows a buy signal.
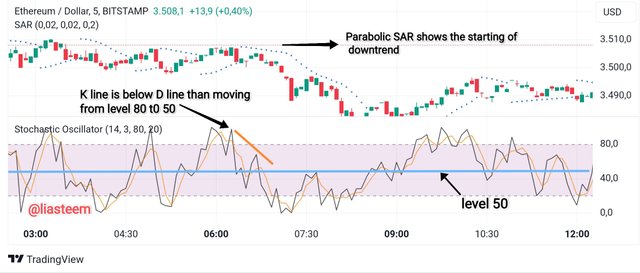
Image source
On the Stochastic Oscillator indicator, Line K crosses line D and level 80 moves down to level 50, while the Parabolic SAR indicator shows a dot above the candle which indicates that the trend is up and this shows a sell signal.
Using historical data, analyze a trading scenario for the STEEM/USDT pair where the Stochastic Oscillator indicated an oversold condition. How would you use this information along with the Parabolic SAR to make a trading decision?
OK, I will analyze a trading scenario for the STEEM/USDT pair where the Stochastic Oscillator indicated an oversold condition between 14 June 2023 to 16 June 2023. Look at the graph below;
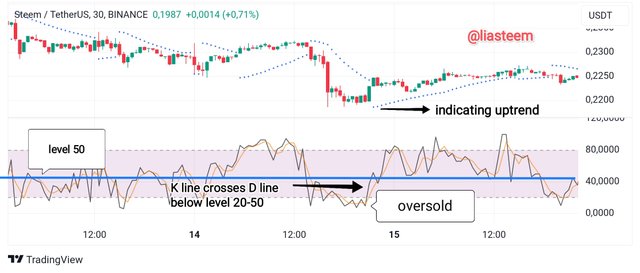
Image source
In the STEEM/USDT chart above, we can see that the Stochastic Oscillator indicator is in oversold condition (below level 20) and that is as of June 14 2024. And the same thing is also shown by the Parabolic SAR indicator which also shows a signal of the starting point of an uptrend .
So, if these two indicators have shown their respective signals, then we can make a trading decision by looking at the situation with the Stochastic Oscillator and Parabolic SAR indicators. When the Stochastic Oscillator indicator is below level 20, it is oversold, while the Parabolic SAR point appears above the candle, which means the trend is down. So, in this situation we can wait a moment until the K line crosses the D line and the Parabolic SAR point appears below the candle, then this indicates that the trend will go up.
On June 14, the long-awaited signal finally appeared, namely the K line crossed the D line and the level rose from 20 to past the 50 level and the Parabolic SAR point appeared below the candle which showed a buy signal until June 15. And on June 15 the signal penetrated to level 80 and was also confirmed by the Parabolic SAR indicator whose point was still below the candle and ended on June 16. At this time the trend is up and the buy signal is confirmed at 0.22 USDT. And Stoploss will be the previous swing level, namely at 0.20 USDT.
Perform a technical analysis on the current STEEM/USDT pair using both the Stochastic Oscillator and Parabolic SAR. Based on your analysis, what would be your trading recommendation?
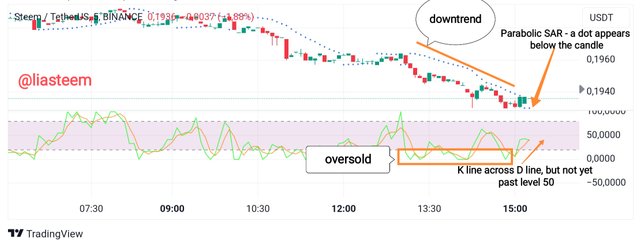
Image source
Currently we can see that the Stochastic Oscillator line has just passed level 20, which means the market trend is in an oversold condition towards level 50. This shows that the market has the potential to experience an uptrend. We also see that several points on the Parabolic SAR indicator are also starting to appear below the candles which usually indicate an uptrend and allow the uptrend to continue even though the K line and D line have not yet reached level 50.
When we are in a condition like this, we should pay attention to this signal, where we will find the K and D lines crossing each other or not. And when the K line is detected crossing the D line, with the K line position from top to bottom, then we can place a buy signal.
So, to analyze the direction of the future trend, my suggestion is that we can look at the Parabolic SAR indicator which appears below the candle which shows that the trend direction has changed to an uptrend. If we are still in doubt, then we can wait for the Stochastic Oscillator indicator line from level 20 to exceed level 50 and the Parabolic SAR indicator to be below the candle and then decide to buy. Don't forget to pay attention to the tail of the candle.
In essence, there is no indicator that 100% guarantees that what is displayed in trading is accurate. However, it's a good idea to analyze the direction of the pa trendSar using indicators will help us reduce trading risk. And it is also important for us to know the background of the assets we trade and that way, we can more easily (calmly and safely) trade, including the STEEMUSDT asset.
Until here, my participation in the Steemit Engagement Challenge S18W5 at SteemitCryptoAcademy.
I would like to invite my friends to participate in this Steemit Engagement Challenge, @eliany @chant @stream4u @sailawana @f2i5 @irawandedy @goodybest @paholags @nancy0 @starrchris @sahmie @hamzayousafzai @el-nailul
greetings,
From your friend
❤
Thank you, friend!


I'm @steem.history, who is steem witness.
Thank you for witnessvoting for me.
please click it!
(Go to https://steemit.com/~witnesses and type fbslo at the bottom of the page)
The weight is reduced because of the lack of Voting Power. If you vote for me as a witness, you can get my little vote.
Upvoted. Thank You for sending some of your rewards to @null. It will make Steem stronger.
I think there is a key point to buy opportunity. thanks for sharing us you clearly separate all things.
Thanks for stopping by on my post my friend, good luck to you too.... 👍
Very nice information shared indicators Stochastics and Parabolic SAR. The way you described details, its very simple term and easy to understand the potentials in this indicators.
Both this indictors worked very well. Cosidering capital and risk factor, we can depends on these indicator and trade at the point sharp when trend is about to change.
Thank you for your nice comment sir...
I really appreciate it.. 😇
Your post has been successfully curated by our team via @𝐢𝐫𝐚𝐰𝐚𝐧𝐝𝐞𝐝𝐲 at 35%.
Thank you for your committed efforts, we urge you to do more and keep posting high-quality content for a chance to earn valuable upvotes from our team of curators and why not be selected for an additional upvote later this week in our top selection.
Kak Lia ajarin saya dong belajar crypto itu 😁.. Semoga berhasil ya kak Lia dis kontes kali ini😊
Hehe ayok...
Biar kita sama-sama belajar,. Dulu, crypto memiliki kursus yang dapat diikuti oleh para steemian dan kita dianjurkan untuk membuat tugas setelah deskripsi dari para profesor crypto...
Kalau sekarang ini mungkin berbeda, namun saat melihat topiknya kita bisa mempelajarinya sedikit demi sedikit... 🤗😘
Ohh iya iya kak, Terimakasih atas penjelasannya yang sangat baik kak lia 😊
🤗😘