You are viewing a single comment's thread from:
RE: Acción del Precio + Estrategias de Acción del Precio - Crypto Academy - Curso Dinámico para Principiantes - S4W4
Greetings @giftye
I will explain what each illustration says so that you can deduce what it is about and submit your homework.
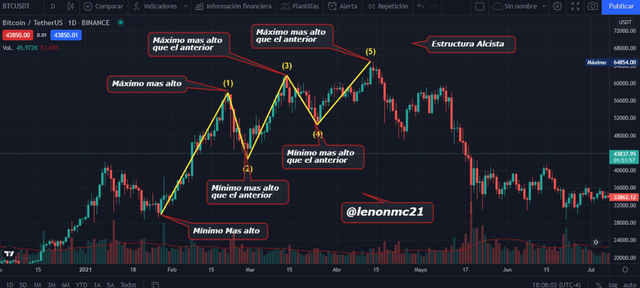
- Image 1: Shows higher lows and higher highs. This is a bullish structure.
- Image 2: Shows the first structure and how it is broken, and a new bearish structure is formed and the beginning of lower highs and lower lows.

- Image 3: Shows a green bullish continuation candlestick, which is the break-even point.

- Image 4: Shows the most relevant "Support and Resistance" points marked on hourly charts.

- Image 5: Shows 2 different breakeven points in important price zones, the yellow and pink lines enclose the high and low of the candles which are the breakeven point.

- Image 6: Shows the image of entries at two break-even points, the yellow lines enclose the high and low of each candle that forms the break-even point.

This is what each image shows, I hope it helps you to understand and be able to perform the task.
Thanks professor,this makes it clearer