Strategy and use of Donchian Channels - Crypto Academy / S5W1 - Homework post for @ lenonmc21


I welcome you all to another season of the steemiy cryptoacademy( season 5 week 1 ). Professor lenonmc21 has made a wonderful lecture which all of us benefitted from it. About donchain channels, though it's my first time heaing about it, but i have learned from the lecture. Below us my homework post.

Explain and define in your own words what the Donchian Channels are?

Donchain channels is an indicator that was established by Richard Donchain which is used in trading matket. Donchain are indicators consist of 3 different lines created or bring into being by trending calculators that is made up of indicator which is established by those 3 lines (Those three lines are -The upper band, the lower band and the middle band). The middle band is found in between the upper and lower band.
The donchain channel is used to indicate the following ÷
- OVERBOUGHT
- OVERSOLD
- POTENTIAL
- VOLATILITY etc
To get the donchain channel indicator, you have ro first of to to your tradingview, for those of us using tradingview. Click the "indicator button" located at the top of the page. The you have to search on Donchain channel. It wil appear then click on it. The donchain channel indicator will now show on your market chart.
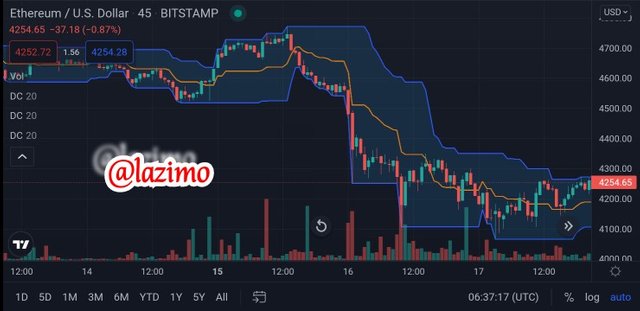
Like i discussed earlier, the donchain channel is made up of three different lines we have the upper band which is in blue colour and we have the lower band which is also in blue colour and the last is the middle band which is in orange colour. Now let me explain what each band are meant for.
The upper band÷ indicates the most highest level that a particular price has hit above the previous 20 candles. So if you draw a box around an area of the 20 candles on the chart, you can see the highest point price hits during that period of time, will be where the upper band will come in.
The lower band÷ indicates the lowest level a particular price has hit over the previous 20 candles. If we show a box around an area of the 20 candles on the chart, you will see the lowest point price hit.
The middle band÷ Its in orange colour, it indicates or its just the average or middle of thr upper and the lower band.
Donchain channel is mostly used by traders to analyze market trends or movement in a given period of time. Also it help traders to esteem bullish trend and bearish trend very easily. The chart below is how a donchain channel looks like.


Does it explain in detail how Donchian Channels are calculated (without copying and pasting from the internet)?

Normally, donchain channel work with its 3 bands placed on the chart. So with that, we can be able to calculate it. The upper band shows the highest point, the lower band shows the lowest point and then the middle band is the average between the upper and the lower band. In this case, we can say that the HH should be the highest point price has hit in previous period, the LL, should be or shows the lowest low a price has hit in the previous period.
So the formula for calculating donchain channel should be÷
Donchain channel(DC)=Highest high(HH) + lowest low(LL) / 2. Ok lets say, the upper band value is = 100, the then lower band value is = 50, so the average betweeen the two is = 75, how do we get 75?, is just 100+50=150 then divide it by 2 you will get 75. So this is how donchain channel are calculated.

Explain the different types of uses and interpretations of Donchian Channels (With examples of bullish and bearish trades)?

Donchain channels us used in indicating the market state like overbought, oversold, potential and viotility.
When it comes to the upper band, it signifies the 20 day high
When it comes to the lower band, it signifies the 20 day low
When it comes to the middle band, it signifies the average from upper to the lower band i.e it is placed in the middle of the upper and lower band.
What can this indicator donchain channel be used for? Donchain channel can be used to specify your high probablility starting point for trading markets.
Also with dobchain indicator, a trader can be able to trade with market trend by analyzing or observing the middle band, to knoe it's current state and also observe the particular place the price is corresponding with middle band.
Now, when the price eventually goes under the middle band, that is when traders normall sell.
Similarly, if the price eventually goes higher more than the middle band, that is when traders normally buy. Using this strategy, you will be able to make goof trade in the market
Also knowing the perfect time to enter the market is another thing donchain channel indicator helps you to know.
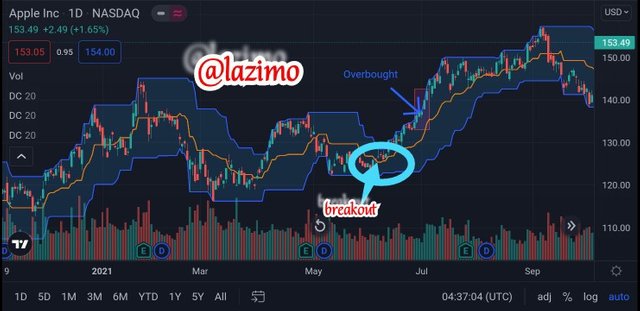
The chart below, you can see where the donchain channel breakout occurs, then the market started bullishing immediately, which shows that its been overbought.

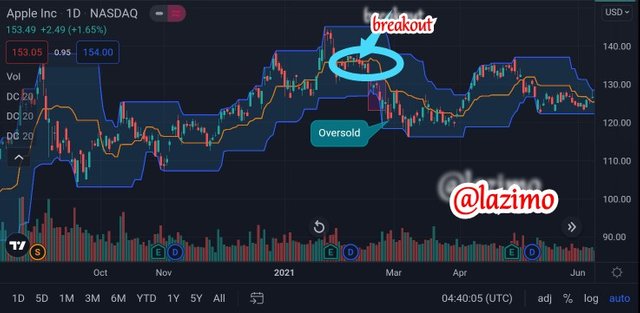
The chart below, you can see where the donchaik channel breakout occurs, then then market started bearishing immediately, which show that its been oversold


Make 1 inning using the "Donchian Channel Breakout Strategy" and make 1 inning using the "Reversal and Retracement Strategy" . You must explain the step by step of how you analyzed to take your entry and make them into a demo account so I can evaluate how the operation was taken.

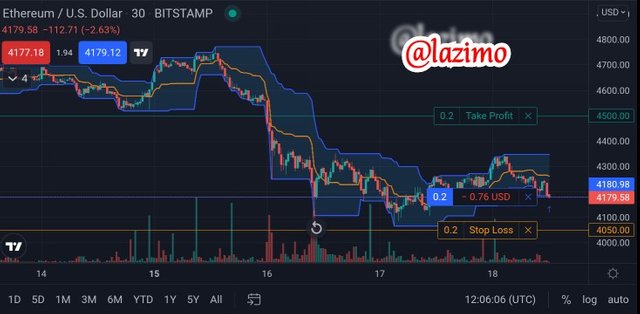
I logged in with my tradingview account, then i choose paper trading as my demo account so i can start trading. I choosed the donchain channel indicator.
Am making use of 30mins chart and using market order to buy ETHUSD. I set my stop loss at 4050 meanwhile the market price is at 4180. Then i set my take profit at 4500.00. Now if the trend eventually breakout the market price and start bearishin, once it hits the stop loss level, it will execute by itself, though i will loose some money.

But if the market eventually trends up and hit the take profit level, it will execute and this means that am gaining.
The screenshot below shows the profit added within 3mins, because the market started bullishing.
CONCLUSION
Donchain channel is an indicator that help traders to trade with trend. Before trading, we pay attention to the 3 bands and see their current state in the market chart, so we can be able to know when to enter the market. All thanks to professor @lenonmc21 for a well detailed lecture, i really learnt a lot.

