[REPOST] "[Trading Using Wedge Pattern] - Crypto Academy / S5W5 - Homework Post for @sachin08".


Good day steemians!!
It's another wonderful new week of the season 5 of steemit cryptoacademy. We are into the week 5 of it. Professor @sachin08 has made a wonderful presentation on Trading using wedge pattern. The lecture was well detailed and explained in a simple words. So below is my homework task for professor @sachin08. Lets go!
No.1 EXPLAIN WEDGE PATTERN IN YOUR OWN WORD.
Using wedge pattern can be very cool if we know how to make use of it. This is another analysis traders makes use of in order to predict the market future. Wedge pattern is commonly used to when there is a reversal in the market chart. So making use of it can tell you when to enter the market and when to exit the market.
From my stand point, wedge pattern can simply be put as technical analysis carried out by traders in order to predict the future trend of the market price in a given timeframe. Wedge pattern can be either up or it can be downwards. This is to say that we have two forms of wedge pattern that traders normally used to enter a buy position or sell position. This are rising and falling wedge pattern. This is simply to say that when a rising wedge pattern occurs, then after a breakout traders tends to take a sell position because the market next trend is to bearish. On the other hand, when a falling wedge pattern occurs, then after a breakout, traders tend to take a buy position because the market next trend is to bullish.
Wedge can simply be drawn with two trendline, i.e the one located at the top side of the trend and the one located below the trends, which serves as support and resistance level. This two trending tends to be moving updwards when it comes to rising wedge pattern and eventually a breakout will occur and there will be a reversal to the opposite trend. On the other hand, the other two trendline tends to be moving downwards when it comes to falling wedge pattern and eventually a breakout will occur and there will be a reversal to the opposite trend.
No.2 EXPLAIN BOTH TYPES OF WEDGES AND HOW TO IDENTIFY THEM IN DETAIL. (SCREENSHOTS REQUIRED)
Like i explained earlier, we have two types of wedge pattern, trader uses to take a buy or sell position. Now i will be explaining the two types of wedge pattern and how to identify in the market chart.
Rising wedge pattern is normally seen as bearish form or category, because after a rising wedge pattern is formed, the next trend after a breakout is bearish trend. So with rising wedge pattern, traders use it to enter a sell position in the market.
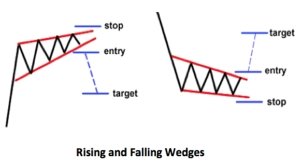
Rising trend can be identified by using two trendlines. The two trendline will serve as support and resistance point. Also this trendlines must be moving upward and the price must at least touch the support and resistance line twice or more than. When you see this, just know that it is a rising wedge pattern and you have to take entry after a resversal. Screenshot below shows example of a rising wedge pattern.
As we can see on the chart above, this is rising wedge pattern using BTCUSD. We can see how how the price was trending up, forming higher highs and higher lows and we can also see how i made the analysis by drawing my two trendlines moving upward, forming a wedge pattern. After this was formed, then there was a reversal which lead to a massive bearish trend.
Falling wedge pattern is normally seen as bullish form or category, because after a falling wedge pattern is formed, the next trend after a breakout is bullish trend. So with falling wedge pattern, traders use it to enter a buy position in the market.
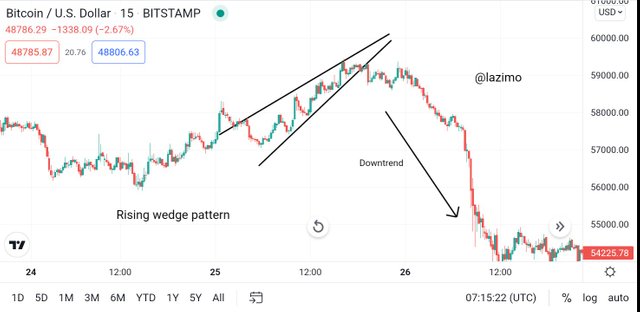
Falling trend can be identified by using two trendlines. The two trendline will serve as support and resistance point. Also this trendlines must be moving downwards and the price must at least touch the support and resistance line twice or more than. When you see this, just know that it is a falling wedge pattern and you have to take entry after a resversal. Screenshot below shows example of a falling wedge pattern.
As we can see on the chart above, this is falling wedge pattern using BTCUSD. We can see how how the price was trending down, forming lower highs and lower lows and we can also see how i made the analysis by drawing my two trendlines moving downwards, forming a wedge pattern. After this was formed, then there was a reversal which lead to a massive bullish trend.
NO.3 DO THE BREAKOUT OF THESE WEDGE PATTERNS PRODUCE FALSE SIGNALS SOMETIMES? IF YES, THEN EXPLAIN HOW TO FILTER OUT THESE FALSE SIGNALS.
Well, i can say that sometimes, this wedge pattern give false signals, i will explain with chart. See this chart below.
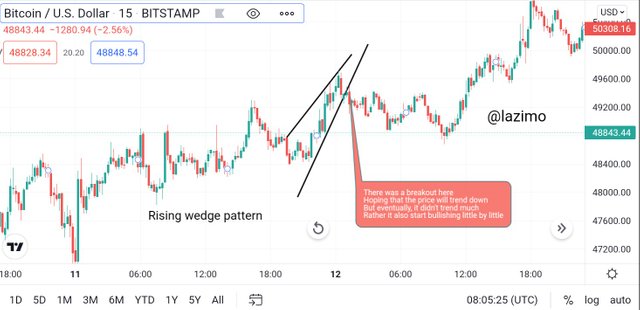
Normally, in wedge pattern, after this was formed, the reversal that will occur suppose go more lower. But in this case, as we can see on the chart i provided above, there was a wedge pattern that was formed, meanwhile traders hope that when a breakout occurs, that will be a reversal to the opposite side, which means that the market will experience a massive bearish trend, since we know that after a rising wedge pattern is formed, the next trend will be bearish trend. But the from the chart above, after the breakout, there was no much bearish trend, rather, the price tend to go high.
So with this, it really shows that sometimes, the wedge pattern can give false signal. But there are ways i suggest one can avoid the false signal. For me, assuming when the price formed a rising wedge pattern, all i have to to is to wait after a breakout, 3 or 4 red candles must be formed before taking my entry (sell position). Also we can add indicator to it, so as to get better results of the trend.
So with all this point i highlighted, i can say that, the wedge pattern can sometimes give traders false signal. That is crypto for you, they are highly volatile, though using technical analysis and indicators can makes us manage risk and not being kicked out of the market.
NO. 4 SHOW FULL TRADE SETUP USING THIS PATTERN FOR BOTH TYPES OF WEDGES.( ENTRY POINT, TAKE PROFIT, STOP LOSS, BREAKOUT)
In this particular section, i will be showing full trade i made using these two forms of wedge patterns. Lets go!
Lets look at the chart below, which shows a full trade set on rising wedge pattern.
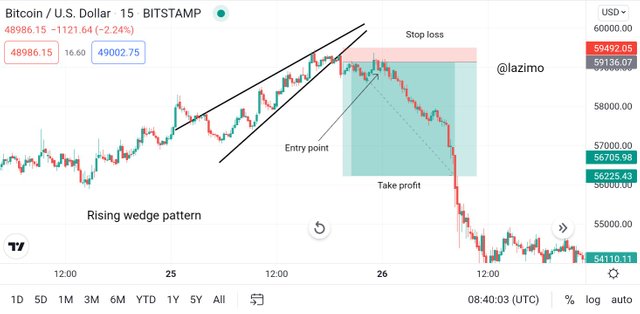
Looking at the chart above shows a trade i made using rising wedge pattern. As we can see on the chart, when the price was rising, hitting the support and resistance point, i performed the analysis, and waited for a reversal to ocvurs before entering a sell position, because we all know that after this rising wedge pattern occurs, the next trend is to bearish.
Now there was a breakout out around 59136.07, the price started trending down. Then i took my entry at 59000.00, set my stoploss at 59492.05 and them set my take profit below the chart which was at 56225.43. Now if the price trends more down and touches my take profit, my order was be executed.
Lets look at the chart below, which shows a full trade set on falling wedge pattern.
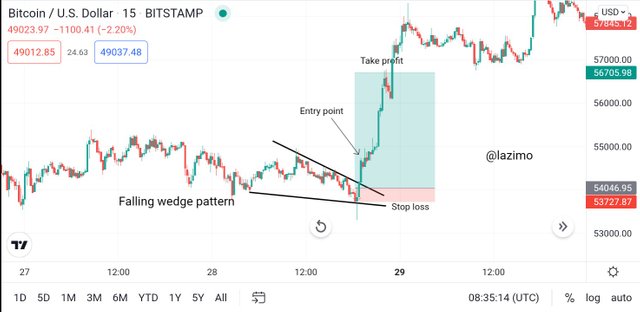
Looking at the chart above shows a trade i made using falling wedge pattern. As we can see on the chart, when the price was trending down, hitting the support and resistance point, i performed the analysis, and waited for a reversal to occurs before entering a buy position, because we all know that after this falling wedge pattern occurs, the next trend is to bullish.
Now there was a breakout out around 54046.95, the price started trending up. Then i took my entry around 54300.00, set my stoploss at 53727.87 and them set my take profit above the chart which was at 56705.95. Now if the price trends up and touches my take profit, my order was be executed.
CONCLUSION
Wedge pattern is mostly used by traders to perform technical analysis before entering a buy position or sell position. Though sometimes it doesn't give us accurate results and we have to know how to avoid false signal using wedge pattern, which i explained above. Professor @sachin08 has made a wonderful lecture which i benefitted from it.
Special regards to -
Professor @sachin08

Original post link