[Recognizing Simple Patterns in Trading] - Crypto Academy / S5W2- Homework Post for @sachin08".

You all are welcome to another new week of season 5 in steemit cryptoacademy. Professor @sachin08 has made a wonderful lecture about recognizing simple pattern in trading. Below is my homework post for this task.
Q1. WHAT IS YOUR UNDERSTANDING ABOUT TRIANGLES IN TRADING. EXPLAIN ALL FORMS OF TRIANGLES IN YOUR OWN WORDS. (SCREENSHOT REQUIRED)
Triangle in trading are horizontal in trading pattern. Triangles in trading can be traded either up(ascending) or down(descending). By placing your buy stop above the resistance level, this shows that you are trading up a triangle. Similarly, by placing your sell stop below or under the support level, this shows that your are trading down a triangle.
The triangle is one of the most common and technical pattern and it's just so easy to identify. In a simple explanation about triangle patterns in trading, it is a continuous chart pattern that is created between the trending movement. When price are continuously moving sideways (ranging movement) and then their will be a breakout consolidation.
WE HAVE THREE FORMS OF TRIANGLES IN TRADING WHICH ARE÷
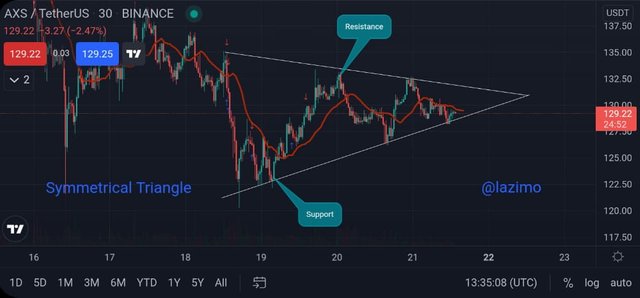
SYMMETRICAL TRIANGLE÷ This is a type of triangle pattern that is being traded by two trend lines which is the upper line that serve as resistance and been connected in lower highs. Also, the lower line moving downward that serve as a support level and is being connected in higher lows. Now both lines hit together at a point and then it forms a triangle to know the direction in which a trend is movin, till when there is a breakout
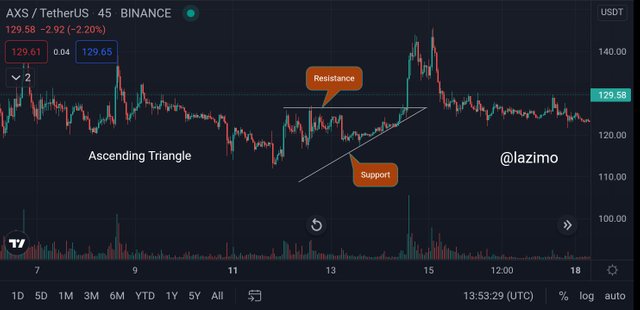
ASCENDING TRIANGLE÷ This is a type of triangle chart pattern that is being formed by two trendlines which are horizontal line, which is located at the top side of the patternvand acts as resistance level and then upward line which is at the downside and acts as support level, connecting the higher lows, then both line hit together at a point and then forms an ascending triangle. This shows a buy opportunity after there is a breakout in the resistance level.
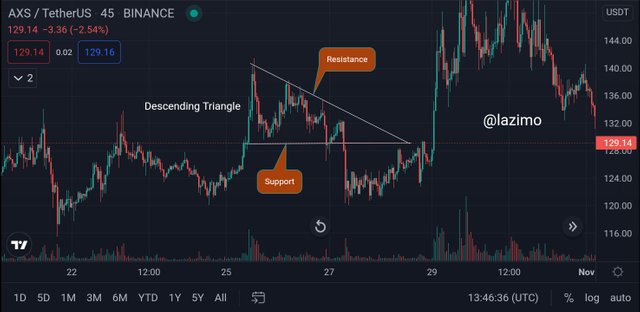
DESCENDING TRIANGLE÷ This is similar to the ascending triangle. It is a type of triangle chart pattern that is being formed by two trendlines which are "horizontal line, which is under side of the pattern and acts like support level and the downward line which is a the top side and acts as resistance level connecting the lower highs. Then the both lines hits together at a point and then forms a descending triangle. This shows a sell opportunity aftrt there is a breakout in the support level
Q2. CAN WE ALSO USE SOME INDICATORS ALONG WITH IT TRIANGLE PATTERNS? EXPLAIN WITH SCREENSHOTS.
Moving average is also an indicator traders mostly use to take entry in the market chart. Using moving average to identify trends is very important and also of value. So when you are trading, you sre looking at area of value and trend. Something that a lot of people use is the 200 day moving average. Am making use of BTC chart. Note that this is technical analysis and sometimes it doesn't.
I will be adding 3 moving average line - 21 day, 50 day and 150 day moving average. Now this is set to my chart.
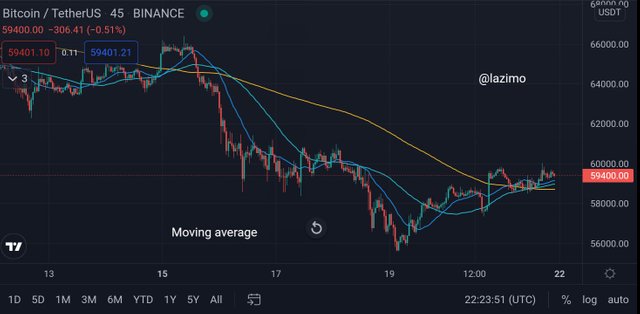
Moving average, to make use of it properly, you have to wait for the fast moving average to cross over or above the slow moving average, thats indicates the opportunity to buy. Meanwhile, when the fast moving average crosses below the moving average it indicate a sell opportunity. So this shows us the entry point and the exist point in a price chart pattern.
Q3. EXPLAIN FLAGS IN TRADING IN YOUR OWN WORDS AND PROVIDE SCREENSHOTS OF BOTH BULL FLAG AND BEAR FLAG.
We should know that, not all flag pattern are created equally.
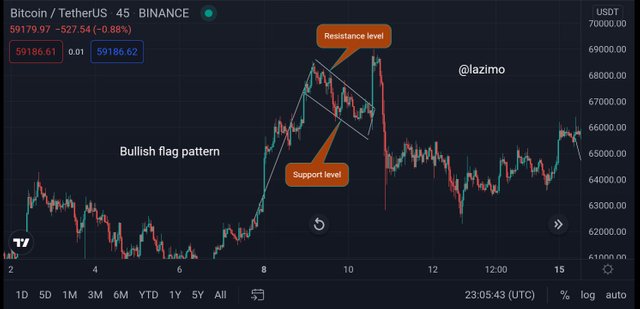
A flag pattern is a strong trending motion and its where a large body candle are see and aslo a weak pull back which indicates a small bodied candle. In a simple explanation, a flag pattern is a small period of consolidation after a directional move in price in which after the small period of consolidation. If we see breakout to the upside, the expectations is that the trend will continue in thay specific direction.
When trading with flag patterns, what we are trying to do essentially, is to capture trend continuation in some was shape of form using breakouts. We are waiting for the market to have big push up then the small period of consolidation have a breakout and that breakouts normally lead to higher price. You can make large profit when trading with flag
So for bullish flag pattern, we would want to see a direction move out of the price, then a small period of consolidation, then we have a greem large candle. After the candle, we arr expecting the market to move higher.
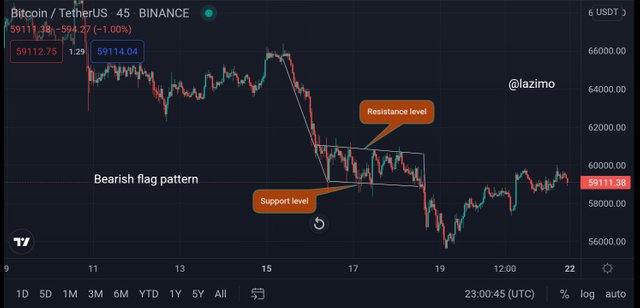
For a bearish flag pattern, we woulf be looking for a directional move to downside, followed by a brief period of consolidation followed by the breakout of that brief period of consolidation and after that breakout , we are expecting the market
Q4. SHOW A FULL TRADE SETUP USING THESE PATTERNS ON ANY CRYPTOCURRENCY CHART. (ASCENDING TRIANGLE, SYMMETRICAL TRIANGLE, BEAR FLAG)
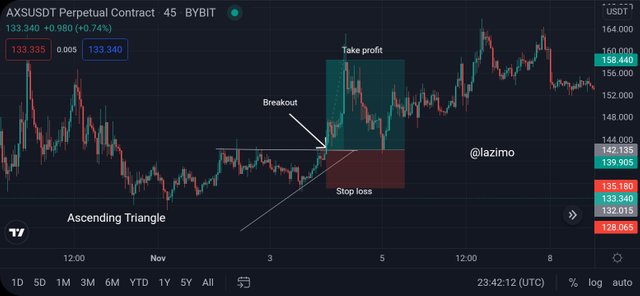
Looking at the chart below, this chart shows triangle set up. You can see where i drew my trend straight line. That serve as resistance level and the upward moving line that serve as support level. The market always reverse, whenever it hits the resistance line, till there was a breakout, then i took my entery.. The market goes up till it hits my take profit.
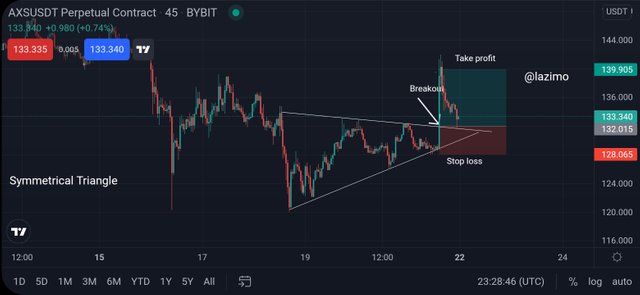
Looking at the chart below, this shows a symmetrical triangle set up. The market was bullishing at first and comes down hitting the support level and goes up again. I use the symmetrical triangle to. make my entry once there was a breakout, then the market goes up and hit my take profit. Also as you can see in the, my stop is set below the support line.
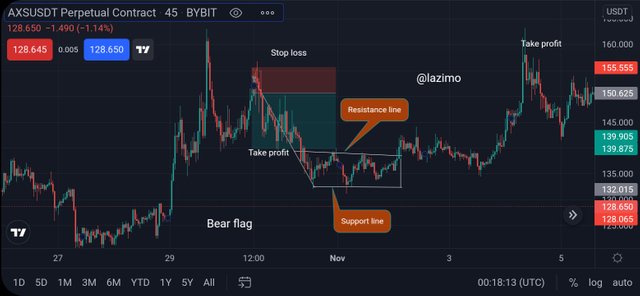
Looking at the chart below, shows a bear flag set up. This bear flag was formed after a massive downtrend in the market price. It looks more like a ranging market. The chart i set up is futures trading. I am shorting the market by predicting that the price will go down after strong bullish. I set up my stop loss at the top, predicting that the price will go down and when it reaches my take profit, it willl execute.
CONCLUSION
As a trader, we should know how to trade eith indicator, so that we can make a good entry point snd exist point. The lecture by professor sachin08 was awesome, i was able to learn about triangles in trading.
Thanks for reading, i appreciate your effort.
Cc-
Professor @sachin08
Hello @lazimo. Thank you for participating in Crypto Academy Season 5 Week 2 Beginner Course.
Feedback and Suggestions -
I appreciate your efforts and will look forward to see your next assignments.
Thank you professor @sachin08 , i will do more better in my next assignment
Hello professor @sachin08
Please this is 6 days now and my post has not been voted.