Candlestick patterns - Steemit Crypto Academy Season 4 - Homework Post for [ @reminiscence01 ] Task 10 || #club5050.

1a) Explain the Japanese candlestick chart? (Original screenshot required).
b) In your own words, explain why the Japanese Candlestick chart is the most used in the financial market.
c) Describe a bullish and a bearish candle. Also, explain its anatomy. (Original screenshot required)
Source

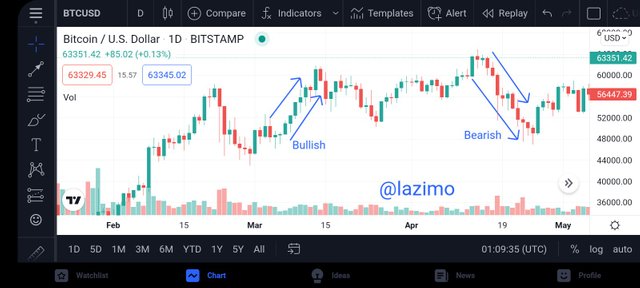
Screenshot source Tradingview
The Japanese candlestick was actually envolved by munehisa homma who was a Japanese rice tradee. The japanese candlestick is form of price chart which indicates all this following÷
- Opening
- Closing
- High and Low in a particular given period of time. Japanese candlestick was invented by a Japanese rice trader ( like i mentioned earlier) and was brought into vogue in yhr 1990s through a broke named Steve Nison.
The Japanese candlestick chart is also used to show how price is moving in the market, which becomes visible in trading charts. It also shows how the buyers and sellers are interacting in the market charts. Traders usually make use og Japanese candlestick chart to predict future price movement in the market.

One of the reasons why Japanese candlestick chart is the most used in finicial market is that, it's very easy tonuse and easy to understand by traders. With Japanese candlestick chart, traders can indicate ir analyze the price movement in the market. Also, using Japanese candlestick, it aims to indicate the type of trend that is taking over the market, this can help to know the right time to buy and the perfect time to sell tokens.
The Japanese candlestick also give full information on how the price is moving in the market. Traders prefee to use Japanese candlestick because of how easy it is, especially, you can identify the current trend in the market just by giving it a look. When look at it, they will be able to know if the market is bullishing or bearishing. They arr very visible because of the colour.

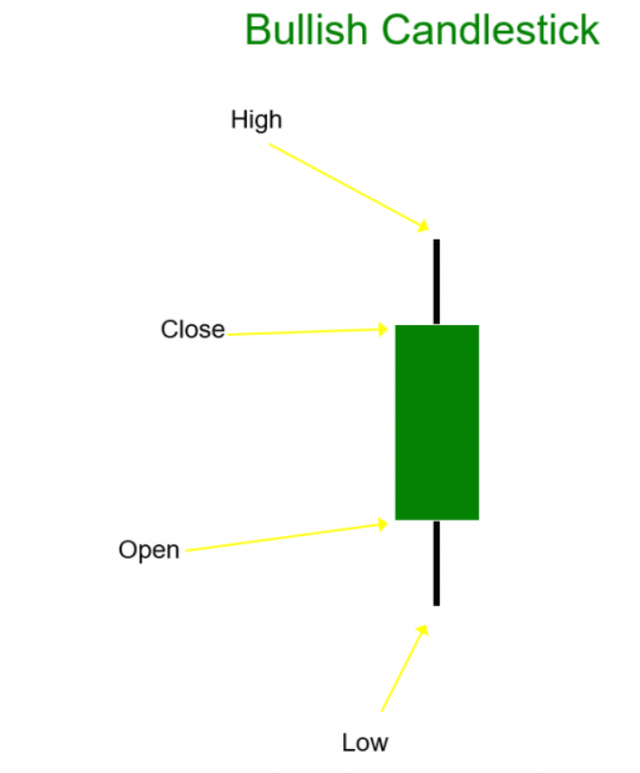
A bullish candlestick is a type of candlestick that are usually green or white in colour. Bullish candlestick tells traders that the market is experiencing uptrend, which means that buyers are in control of the market.
When we talk about "" Bullish" it also means that stockholders have the belief that the market will trend up. It accomodates all features of candlesticks, such as
| The high | Low |
|---|---|
| Open | close |
| The real body | --- |
| Upper shadow | Lower shadow |
Bullish candlestick method shows or alerts traders to know that the matket is about to experience uptrend after the price gell before and this shows that the buyers which are the bulls havs taking over the market.
BULLISH ANATOMY
THE OPEN
It specifies the starting price on a token in a particular given period abd it's usually below the bullish candlestick.
THE CLOSE
This is the opposite of Open. It specifies the ending price on a token in a given period and it's always above the bullish candlestick.
HIGH
It shows or specifies the highest token that was purchased in a given period.
LOW
It shows or specifies the lowest token that was purchased in a given period.
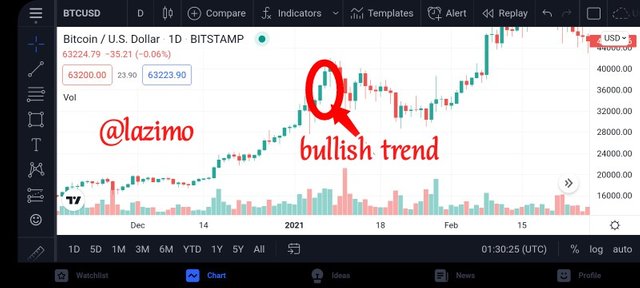
Screenshot source Tradingview

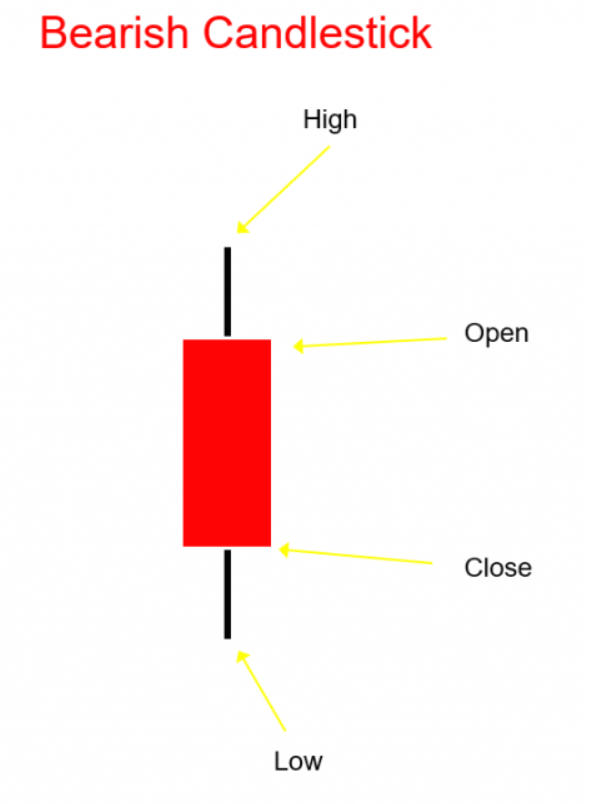
The word "Bearish" shows that the stockholder have the belief that the market will experience downtrend. A bearish candlestick is a type of candlestick that is usually red or black colour. Bearish candlestick tells that the market is experiencing downtrend, which means that seller arr in control of the market. This shows that the market price is getting low and it specifies the time in which close is in lower grade more than that of open
BEARISH ANATOMY
THE OPEN
This specifies the starting price on a token in a given period and it's always above the bullish candlestick.
THE CLOSE
This specifies the ending price on a token in a given period and it's always below the bullish candlestick.
HIGH
This specifies the highest token that was purchased in a given period
LOW
This specifies the lowest token that was purchased in a given period.
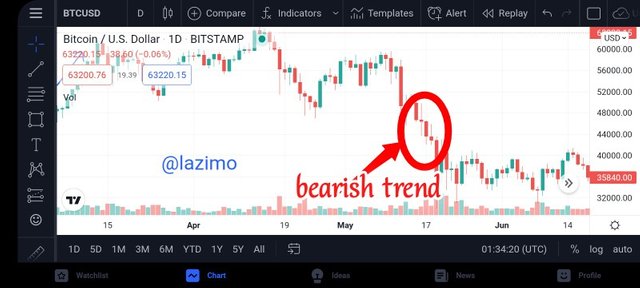
Screenshot source Tradingview

CONCLUSION
Trading with Japanese candlestick is very good and easy to understand. That is why most traders make use of it. The lecture was awesome and well detailed. I was able to learn a lot about Japanese candlestick..
Please do not use the #club5050 tag unless you have made power-ups in the last month that are equal or greater than any amount you have cashed out.