[Trading with Contractile Diagonals] - Crypto Academy / S4W3- Homework Post for @allbert
.jpg)
Hello, fellow steemians. This article is my submission to Professor @allbert's assignment on the lecture Trading with Contracile Diagonals. The homework was given as below:
1- Define in your own words what a contractile diagonal is and why it is important to study it. Explain what happens in the market for this chart pattern to occur. (screenshot required / Bitcoin not allowed)
2- Give an example of a Contractile Diagonal that meets the criteria of operability and an example of a Contractile Diagonal that does NOT meet the criteria. (screenshot required / Bitcoin not allowed)
3- Through your Verified exchange account, perform one REAL buy operation (15 USD minimum), through the Contractile Diagonal method. Explain the process and demonstrate the results and graphical analysis through screenshots. Your purchase data must match your analysis data: such as cryptocurrency and entry price.
4- Through a DEMO account, perform one sell operation, through the Contractile Diagonal method. Explain the process and demonstrate the results and graphical analysis through screenshots. Bitcoin is not allowed.
5- Explain and develop why not all contractile diagonals are operative from a practical point of view. (screenshot required / Bitcoin not allowed)

Define in your own words what a contractile diagonal is and why it is important to study it. Explain what happens in the market for this chart pattern to occur

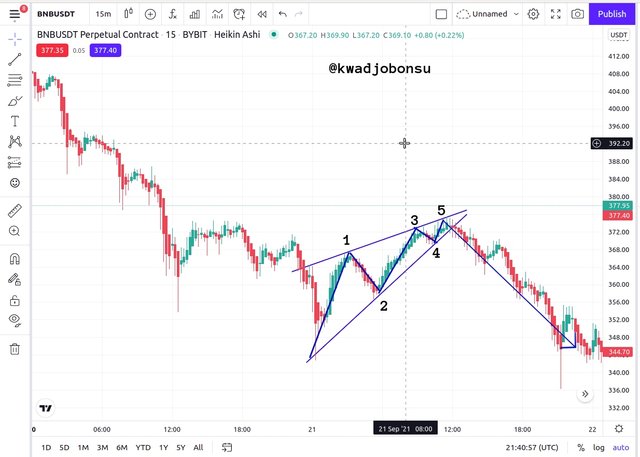
During the process of performing traders, traders are always on the lookout for repetitive patterns that can help them in forecasting the price inclination of assets on the market with a fair degree of precision, and one of the frequent price patterns of assets on the market is the Contractile Diagonal, which can also be alluded to as a Wedge. Contractile Diagonals are patterns that can be recognized with ease due to their peculiar traits.
These features rely on the wave-like course of the price of an asset within the corresponding time frame on the charts. Identification of wedges is done with the overlay of trendlines, usually two, that move in a convergent behavior as if they are about to meet. These lines function as resistance and support for the particular waves under consideration. These waves adhere to the 1,2,3,4, and 5 wave trends. The 1,3, and 5 are the price bumps located on the resistance/support trendline, whereas the 2 and 4 are respective price changes that correspond to the support/resistance trendlines, depending on the direction of the market.
Other key characteristics of the Contractile Diagonal pattern are the decreasing volume of trade of the asset and the emergence of a new price trend. The decreasing volume of the asset operation on the market is evident through the reduction in the wavelength of the wedges as support and resistance trendlines begin to merge. Also, such activities are usually followed by either a bullish or bearish price direction.
The formation of wedges arises when traders execute buy or sell orders from an intense magnitude to a lesser magnitude, and as a result, the current bullish or bearish trend thwarts as they are not many executions to keep the market going in that respective direction due to the reduced trade volume. Hence, the alternate form of traders take over the market and direct it from a bullish trend to a bearish one and vice versa. Hence, this explains the characteristic breakout feature of contractile diagonals.
This pattern is of essence to traders because the intensive breakouts serve as opportunities for traders to capitalize on the conditions of the markets to make profits while practicing good risk management by setting the TP and SL at vantages points that are relative to the certain position on the diagonals. Additionally, it is easy and quite common to identify.

Give an example of a Contractile Diagonal that meets the criteria of operability and an example of a Contractile Diagonal that does NOT meet the criteria

The validity of a contractile diagonal is contingent on multiple factors, aside from the expectation of a violet price reversal. As mentioned earlier, the diagonal trend lines should converge, and this shape is due to the gradual reduction of the volume of the particular type of dominating transaction. Due to this, the wave shape of the price action must stick to a particular design, as described below.
For bearish price action, the first support trend line that will be drawn must hit Pivot 1, and subsequently Pivot 3 and Pivot 5. All these points must be in agreement. The length of each previous wave must be taller than its next. Thus, the height of Wave 1 should be higher than that of Wave 3, and Wave 3’s length should be greater than that of Wave 5. The resistance trend line, on the other hand, has to touch both Pivot 2 and 4 in a congruent manner. If all these criteria are not satisfied, the section of that particular chart of the asset should be discarded.
For bullish price action, the initial resistance trend line that will be drawn must hit Pivot 1, and subsequently Pivot 3 and Pivot 5. All these points must be congruent. The length of each preceding wave must be longer than its immediate kin. Thus, the length of Wave 1 should be greater than that of Wave 3, and Wave 3’s length should exceed Wave 5. The support trend line, on the other hand, has to touch both Pivot 2 and 4 in a congruent manner. If all these criteria are not satisfied, the section of that particular chart of the asset should be discarded.
An Instance of a Contractile Diagonal that does not satisfy the requirements
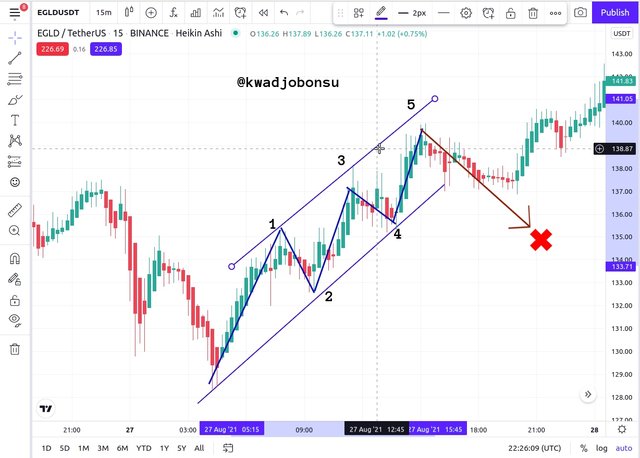
With the image of the EGLDUSDT pair chart above, the time interval selected was 15 minutes on the Tradingview platform. I consider this chart an ineligible contractile diagonal because it does not meet the demands of the pattern. Wave 1 is longer than Wave 3. However, wave 3 and wave 5 are of similar lengths, and this breaks the rules. According to the rules, the wavelength of wave 5 must be shorter than that of wave 3.
Furthermore, the reversal price breakout moved momentarily in the correct bearish direction but later reversed back into a bullish trend. This can pose danger for traders who do not put the appropriate Stop Loss and Take Profit measures required of Wedges. Clearly, with this chart, the cautious trader would have been able to scalp some profits. Inexperienced traders, on the other hand, would have experienced a significant loss since the price reversal did not hold.
An Instance of a Contractile Diagonal that satisfies the requirements

With the image of the BNBUSDT pair chart above, the time interval selected was 15 minutes on the Tradingview platform. This is an eligible contractile diagonal because it satisfies the demands of the pattern. Wave 1 is longer than Wave 3. Wave 3 according is longer than Wave 5. Also, the length of wave 2 is higher than the length of wave 4.
The trend lines are also seen converging. Additionally, the price reversal is accurate and holds for a longer period. Therefore, traders will the appropriate TP and SL in place would have to experience a closed order with significant profits. Considering all these factors led me to conclude that this chart is a valid Contractile Diagonal pattern.

Through your Verified exchange account, perform one REAL buy operation (15 USD minimum), through the Contractile Diagonal method. Explain the process and demonstrate the results and graphical analysis through screenshots. Your purchase data must match your analysis data: such as cryptocurrency and entry price.

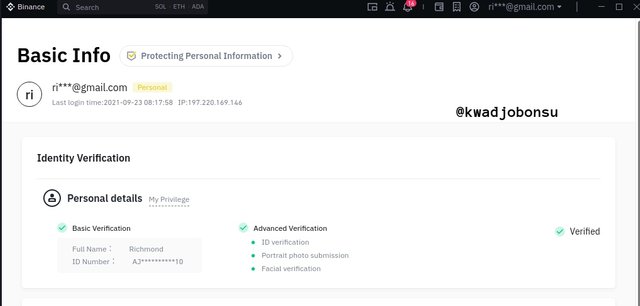
Before I demonstrate the purchase, I would like to show that my account on the Binance platform is verified. The above screenshot is from the Personal Information area of the Binance Desktop application on my laptop.
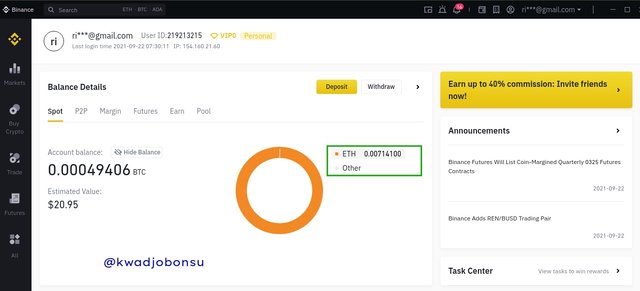
Also, I had in holdings twenty Dollars worth of Ethereum in my Spot account on the Binance platform. The respective number of Ether is highlighted with the green box. I had 0.00714100 ETH.
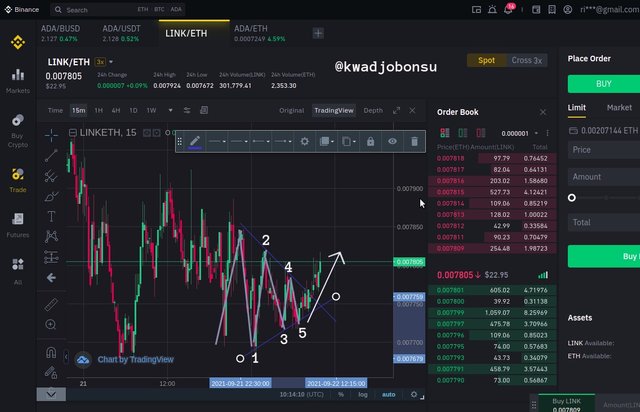
For the trade, I used the LINKETH pair chart on the Binance desktop application. It can be seen from the screenshot that a valid Wedge or Contractile diagonal had been identified. It was moving in a bearish direction. The length of Wave 1 is longer than the length of Wave 3, and the wave 3 length is longer than that of wave 5. Wave 2 has a length higher than that of wave 4.
Also, the trend lines with blue colors are moving in a convergent manner. The Pivots 1, 3, and 5 are all in agreement on the support line, likewise the points 2 and 4. Furthermore, the breakout moved in a correct reversed direction, thus in a bullish trend in this case. So after confirming the validity of the Contractile Diagonal pattern, I placed a Limit Buy order for $15 worth of LINK using my ETH balance in my Spot account.
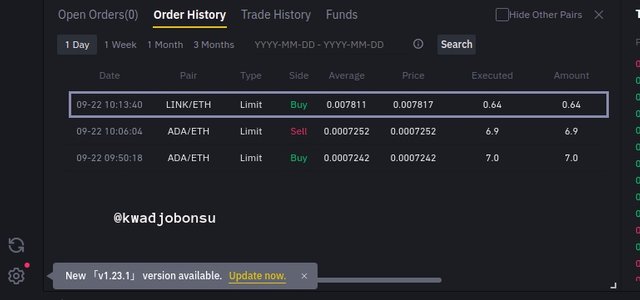
An amount of 0.64 LINK was purchased at the price of 0.007817. There were also no Bid-ask spreads as the executed 0.64 was exactly the received amount.

Through a DEMO account, perform one sell operation, through the Contractile Diagonal method. Explain the process and demonstrate the results and graphical analysis through screenshots

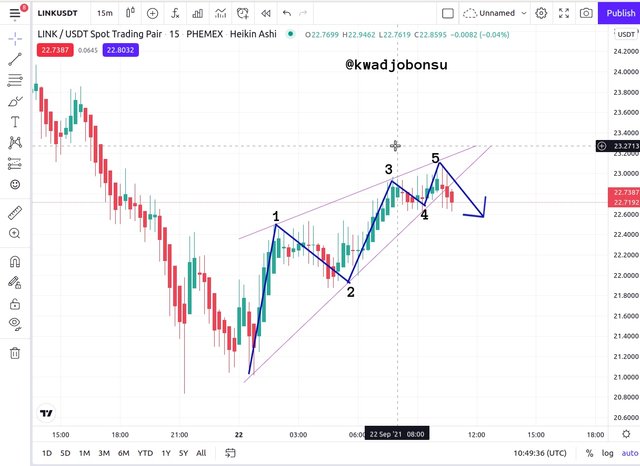
For the demonstration in this section, I used the Paper Trading account on the Tradingview platform. The LINKUSDT trading pair chart was used. The selected time interval was 15 minutes. First, let us assess the validity of this Wedge. The length of Wave 1 is longer than wave 3. Wave 3, in the same manner, is longer than Wave 5. Also, Wave 2 is lengthier than wave 4. The support and resistance diagonals are seen converging as the respective pivots are congruent on each trend line. The general price direction was a bullish one. Hence, the bearish breakout identified in the chart is valid.
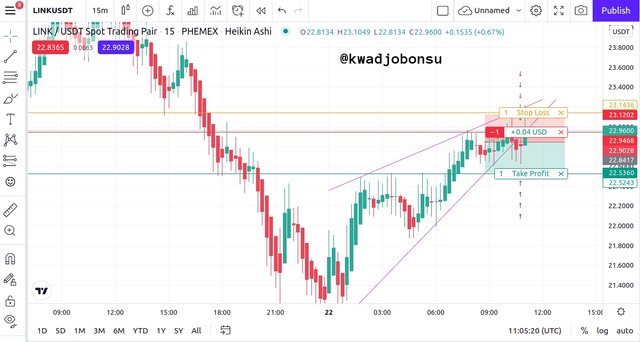
I executed a Sell order with good risk management plans in place. Ideally, I acknowledge that the Take Profit margin should have been set to Point 2. However, I was not planning to stay on the markets for long. Also, it is apparent that the Take Profit area far exceeds the Stop Loss area. This implies that the Reward-to-Risk ratio was good. Few minutes, after the order execution, a profit of 4 cents showed as demonstrated in the chart above.

Eventually, I closed out the order with a profit of $0.12, as highlighted in the screenshot of the Account history of the Paper Trading account on the Tradingview platform.

Explain and develop why not all contractile diagonals are operative from a practical point of view.

Not all contractile diagonals are considered operable in the sense that such diagonals do not strictly follow the rules established. As mentioned earlier, the wave 1, 3, and 5 must follow in the order of reduced wavelengths. This principle also applies to waves 2 and 4. Also, the trend lines must touch all the pivots of Points 1, 3, 5, and 2, 4 at the respective side of the price fluctuations. The reversal breakout must hold for a longer period, and good risk management must be placed so the take profit is set to the point 2 margins, whereas the Stop Loss margin is set to the Point 5 margin.
.jpg)
From a practical stance, this XRPUSD chart shows a contractile diagonal. The length of wave 1 is longer than wave 3, and waver 3 is longer than wave 5. Wave 2, likewise, is longer than wave 4. However, the support trend line drawn does not touch all the points. It touches Point 1 and Point 3, but the area indicated 5 is not the pivot of Point 5. Hence this diagonal is not operative as it does not meet all the requirements, even though the reversal breakout was accurate.
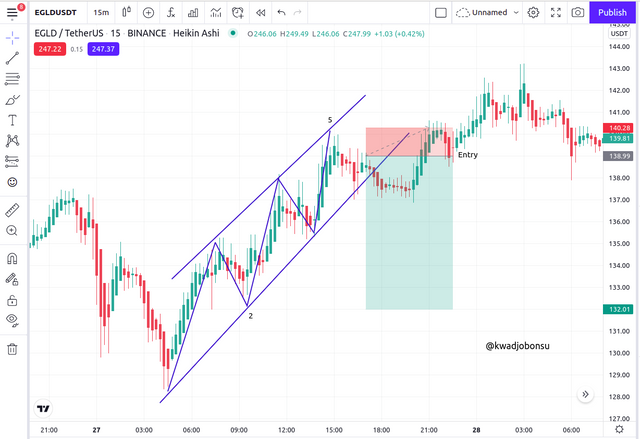
In this chart of EGLDUSDT, all the wavelength and diagonal trendline requirements are met. However, the breakout is problematic. The Take Profit margin is set to the Pivot 2 because the bearish trend is expected to hold at least to that level. The Stop Loss is also set to Pivot 5 for the sake of a great Reward-to-risk ratio. In the scenario above, the bearish movement of the asset was not sustained and shortly resumed a bullish path. Traders will proper risk management in place, would have experienced a loss had they been waiting extensively for the bearish trend to enter the Pivot 2 margin

Conclusion

Contractile diagonals are fairly easy to spot on the market, and their requirements are simple to comprehend. This pattern can be recognized at various time intervals on the charts of different assets. Its presence indicates a pending reversal, which traders can capitalize on to acquire profits. Contractile Diagonals also demand good risk management, and this aid in protecting traders from false signals since no pattern is one hundred percent accurate all the time.
I am glad that I was given this opportunity to be educated on such an essential tool for trading. I thank Professor @allbert for this wonderful lesson.