Trading with Accumulation / Distribution (A/D) Indicator - Steemit Crypto Academy / S4W5- Homework Post for Professor @allbert
.jpg)
Hi, fellow steemians. I am well, and I hope you are too? This post is my submission to Professor @allbert's lecture on Trading with Accumulation / Distribution (A/D) Indicator. The assignment was given as below:
1- Explain in your own words what the A/D Indicator is and how and why it relates to volume. (Screenshots needed).
2- Through some platforms, show the process of how to place the A/D Indicator (Screenshots needed).
3- Explain through an example the formula of the A/D Indicator. (Originality will be taken into account).
4- How is it possible to detect and confirm a trend through the A/D indicator? (Screenshots needed)
5- Through a DEMO account, perform one trading operation (BUY or SELL) using the A/D Indicator only. (Screenshots needed).
6- What other indicator can be used in conjunction with the A/D Indicator. Justify, explain and test. (Screenshots needed).

Explain in your own words what the A/D Indicator is and how and why it relates to volume

Developed by Marc Chaikin, the A/D indicator is one of the commonly used technical indicators by traders and investors. It assesses the volume of trades on the market of an asset and communicates the corresponding accumulation pressure or distribution pressure. The word Accumulation is primarily related to the demands or buying pressure on the asset’s market, whereas Distribution is an allusion to the supply or selling pressure or level. The A/D indicator measures the respective characteristics of the market cumulatively.
The demands and pressure of the cryptocurrency asset on the market together with the volumes of the trader precede and drive up or down the financial entity’s price point on the market. For instance, when the buying pressure is high, the price of the asset soars. Alternatively, the price of the financial element diminishes when there is a heavy level of supply on the market. Therefore by using the Accumulation/Distribution technical indicator, traders can observe the voluminous trend of the demand and supply of the asset on the market and be able to make forecasts with a fair degree of accuracy.
The A/D indicator is usually symbolized graphically with a line. This line wavers up, down, and sideways to communicate the corresponding condition of the market. It is also used to authenticate the trends discerned on the chart, and it, as well, shows the incidence divergence of the asset’s price point.
These characteristics enable traders to assess how strong or weak the market trends are and aid them in making good trading decisions. It is fairly easy to apply on the market and simple to comprehend. This indicator also gives a good indication of the market’s level of liquidity, as it fundamentally shows the intensity of buy or sells entries.
Like any indicator on the market, the A/D indicator is not perfect. It has a reasonable dose of demerits concerning its application. One of the shortcomings of this indicator is that it is unable to account for the rate of price gaps on the markets, which is a significant metric that helps traders in staying abreast with the situation of the market.
Also, this indicator has low sensitivity when compared to other highly sensitive indicators, as its response to price movements that are considered minor is on the low. Furthermore, the A/D indicator is prone to giving false signals. As a result, it is often combined with other indicators for confluence and the elimination of inaccurate signals.
To this end, the Accumulation/Distribution indicator is a great tool to measure the volubility direction of an asset’s market. Regardless of the advantages it presents, it is important that traders employ other indicators or metric tools to check for confluence before placing orders on the market.
Through some platforms show the process of how to place the A/D Indicator
For this section, I used the Tradingview platform, and the Ethereum-Tether cryptocurrency pair was selected. Now I shall demonstrate how to add an A/D indicator as well as the steps to configure the chart of the indicator.
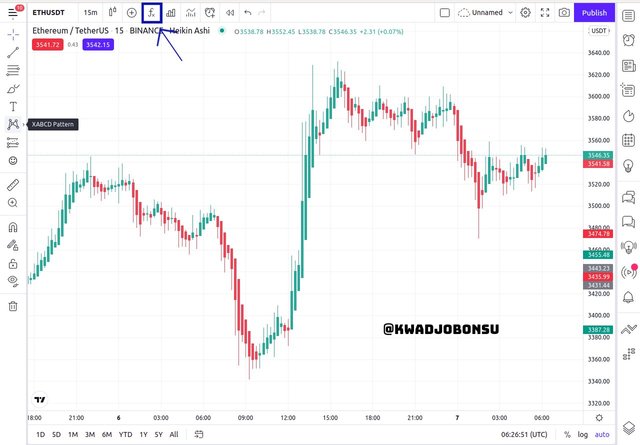
- First, I clicked on the Indicators and Strategies button as highlighted in the image above.
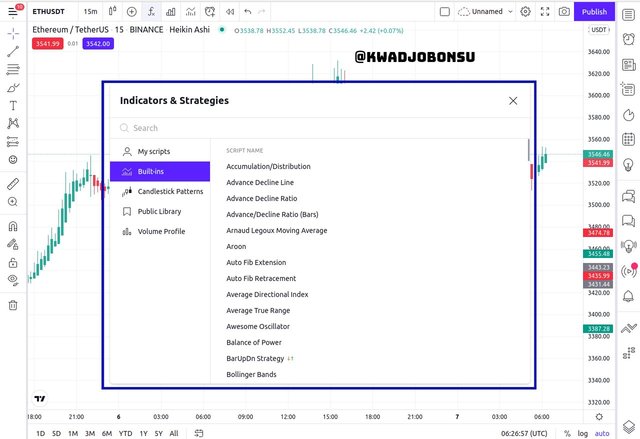
- A dialog box shows listing a number of inherent indicators and strategies on the Tradingview platform. The Accumulation/Distribution indicator is first on the list.
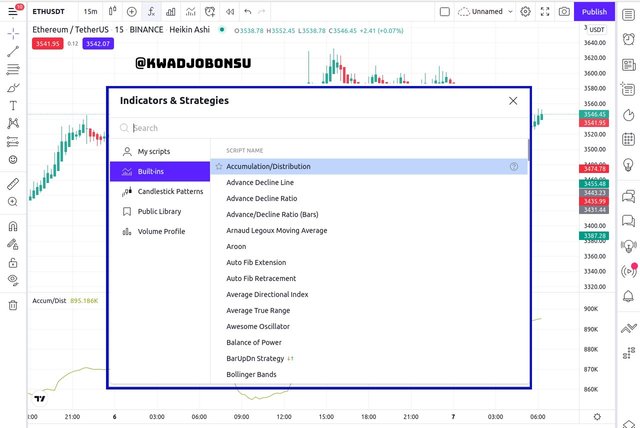
- I selected the Accumulation/Distribution indicator and it was added accordingly.
- The A/D Indicator for the ETH/USDT chart is highlighted in the screenshot above.
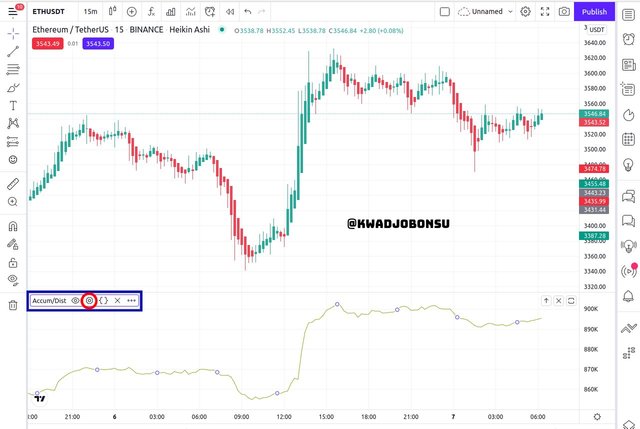
- To configure the A/D indicator, click on the Settings button.
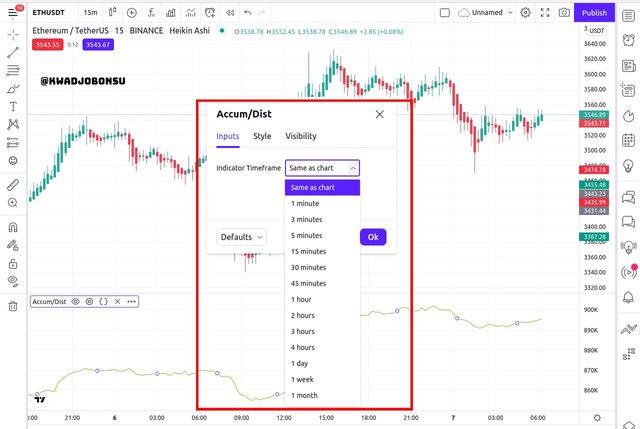
- A dialog box will show will three tabs. The first tab permits users to alter the time frame of the indicator. I selected 15 minutes.
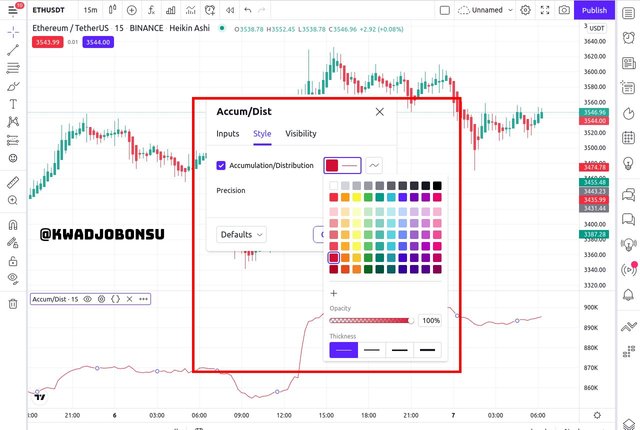
- The next tab allows traders to change the style of the indicator. I selected the red color for the line of the indicator.
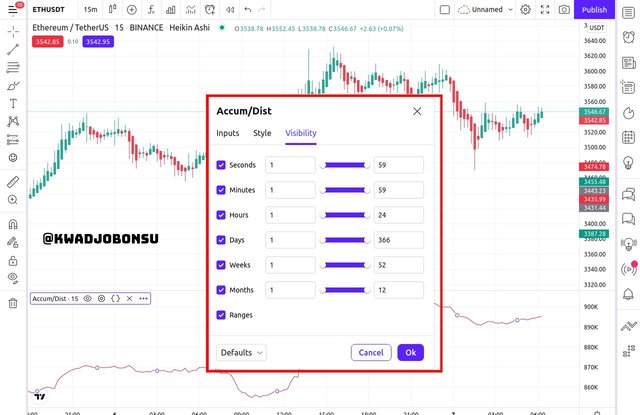
- The final tab makes room for some time-related configuration to be made.
- The configured A/D indicator with a highlighted 15 minutes time frame and a red color is shown.
Explain through an example the formula of the A/D Indicator.
The formula for the A/D indicator is as below:
Accumulation/Distribution Indicator =
The previous value of A/D + The recent Money Flow Volume
The recent Money Flow Volume =
The Money Flow Multiplier * The Volume at the current period
The Money Flow Multiplier = ( CP – MnP ) - ( MxP – CP ) / ( MxP – MnP)
CP = The closing price of the asset
MnP is the Minimum price point of the asset
MxP is the Maximum price point of the asset
Now to put this formula into practice, let us first consider real parameters from the chart of ETHUSDT Binance on Tradingview.
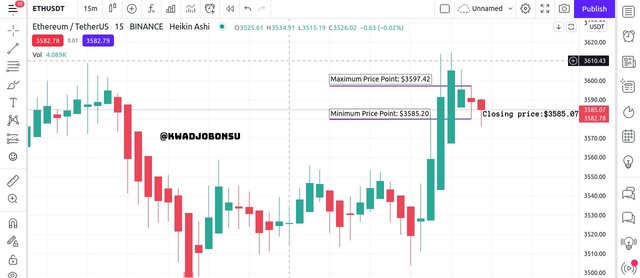
The Maximum Price Point of the Asset for the previous candle = $3597.42
The Minimum Price Point of the Asset for the previous candle = $3585.20
The Closing Price Point of the Asset for the current candle = $3585.07
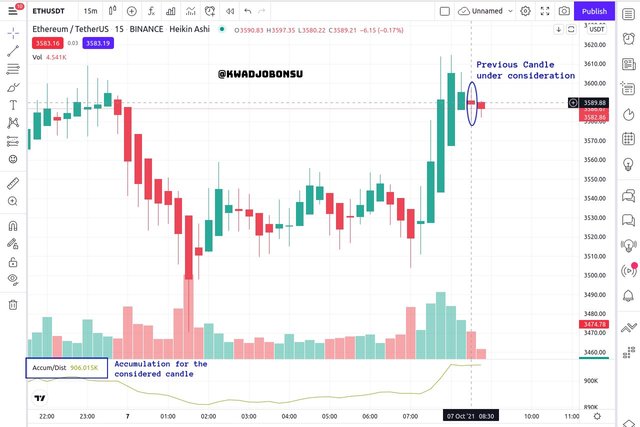
The Previous Accumulation/Distribution is 906,015
The recent volume at the time of writing is 5120
- The Money Flow Multiplier =
( 3585.07 – 3585.20 ) - ( 3597.42 – 3585.07 ) / ( 3597.42 – 3585.20)
= ( −0.13 ) - ( 12.35 ) / ( 12.22)
= ( −12.48 ) / ( 12.22)
= −1.021276596
- The recent Money Flow Volume =
−1.021276596 * 5120
= -5228.936
- Accumulation/Distribution Indicator =
906,015 + (-5228.936)
= 900786.064
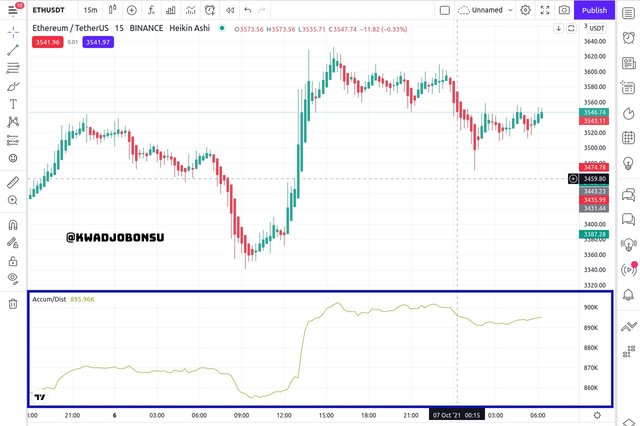
How is it possible to detect and confirm a trend through the A/D indicator?
1. Bullish and Bearish Trends
Technical indicators are used by traders to primarily determine price directions and market conditions so that the appropriate market entries can be made to acquire profits or secure current market positions from incurring severe losses. The A/D indicator is used accordingly to assess the market conditions and the price point trend of the assets. It is used to confirm bullish or bearish market direction inferred from the price actions or other indicators.
When the price actions of the chart are in continuous upward trends and the A/D indicator is also in an upward trend, this indicates accumulation. What this means is that there is a high buying pressure on that asset’s market with respect to that period of time. Hence, there is the dominance of buyers, and this event will drive up the price of the asset.
Alternatively, when the price action of the chart is in a downward trend and the A/D indicator follows accordingly, this signifies distribution. With distribution, there is a high selling pressure as sellers have dominated the market of the asset at that particular point in time. Traders' ability to recognize these trends enables them to accumulate assets or sell them at high prices to realize profits.
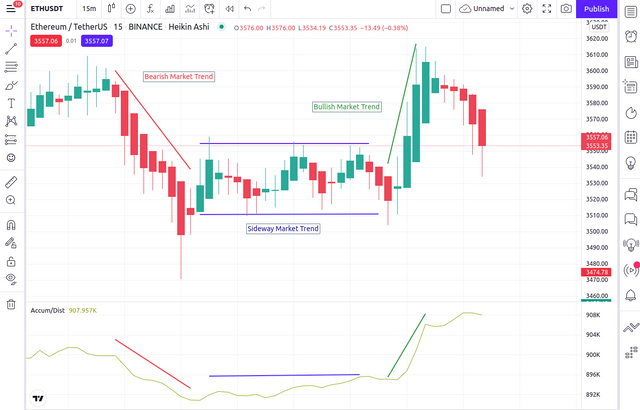
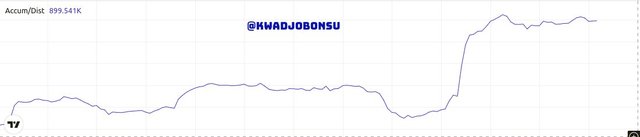
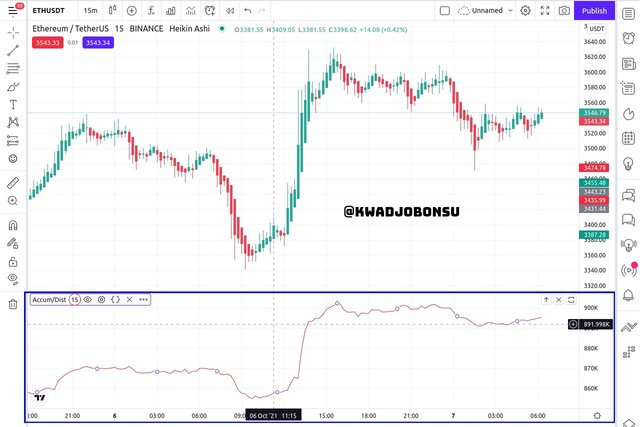
Considering the ETHUSDT chart above, it can be observed that a bearish market movement was confirmed by the A/D indicator as it also moved in a downward fashion. This trend denoted distribution as there was an intense selling pressure on the market during that window of time. The bearish and distribution instances are highlighted accordingly with a red line.
The bullish movement, highlighted with a green line, was in accordance with the upward movement of the A/D indicator. This trait signaled accumulation as there were more buying activities on the market, which drove the price of the assets up. During sideways market trends, there is not a sharp rise or fall in the A/D indicator.
2. Divergence
The Accumulation/Distribution Indicator is also an effective tool for identifying divergence. Divergence is, in a nutshell, is when the trend of an indicator is antithetic to that of the chart. So a bullish price movement will be followed by a downward trend on the indicator and vice versa. This event is a message that the current volume may not suffice in sustaining the current price direction of the asset on the market. Hence, a reversal of the price direction is imminent.
Knowledge of this market condition can aid traders in preparing for the reversal so that they can capitalize off them to acquire profits. Traders can place sell orders in the event of a bearish divergence after the bearish price direction begins or a buy order with respect to a bullish divergence once the price action of the chart forms an upward price movement. The ability to recognize divergence also prevents traders from falling for wrong market signals from price actions.
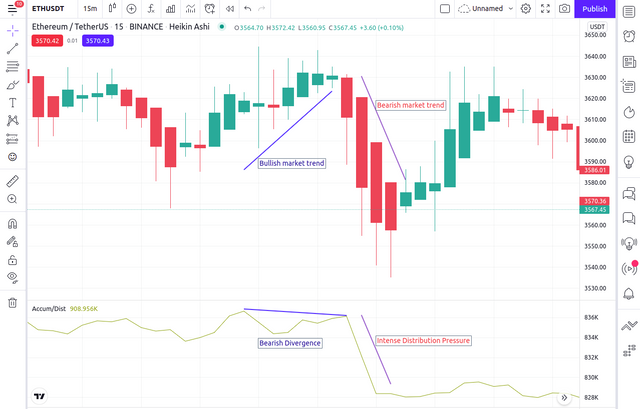
In the ETHUSDT chart above, it can be observed that during the bullish market movement of the asset, the reading of the A/D indicator was a downward one, indicating a bearish divergence. This feature communicates the insufficiency of buyers on the market to maintain the upward trend. Therefore, a bearish reversal was imminent. Indeed, a bearish price reversal, which was also confirmed by the distribution direction of the A/D indicator, followed afterward.
Through a DEMO account, perform one trading operation (BUY or SELL) using the A/D Indicator only
For this section, I used the Tradingview platform and its paper trading account to execute this task. The Select cryptocurrency pair was DOTUSDT at 15 minutes timeframe. I detected a bullish divergence between the price movement and the A/D indicator.
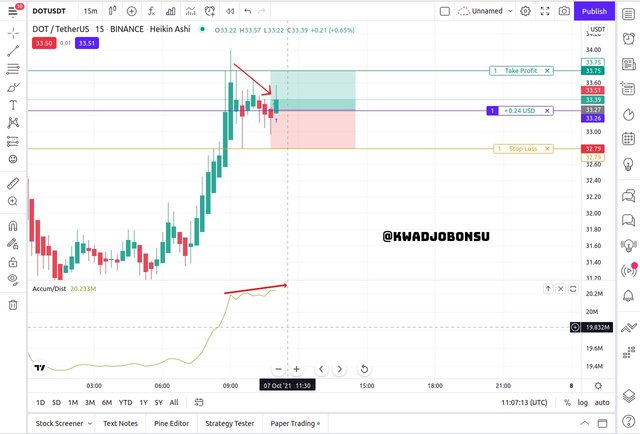
As highlighted above, the price direction was downward, but the corresponding readings on the Accumulation/Distribution graph were upward. This denotes Bullish divergence. It means that there are not enough sellers on the market at that particular point in time to sustain the bearish market direction. Hence, a bullish reversal is nearby. I waited for a bullish candle to show before entering the market.
An effective risk management structure was put in place. I set the Stop Loss level slightly below the lowest impulse of the bearish candle and set the Take Profit margin at a corresponding percentage. The StopLoss/Take Profit ratio was 1:1. At the time of the screenshot, the paper profit of my entry was $0.24.
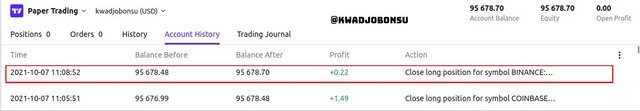
The order was closed at a profit of $0.22 as highlighted in the screenshot above.
What other indicator can be used in conjunction with the A/D Indicator. Justify, explain and test.
Admittedly, no indicator is one hundred percent accurate. The Accumulation/Distribution indicator is no different. There are instances where it can render false signals. Also, it fails to highlight certain conditions of the market due to the factors it incorporates in its computation process. Hence, there is the need to combine the usage of the A/D indicator with other technical indicators to gain a different look at an asset’s market development and also check for confluence between the two forms.
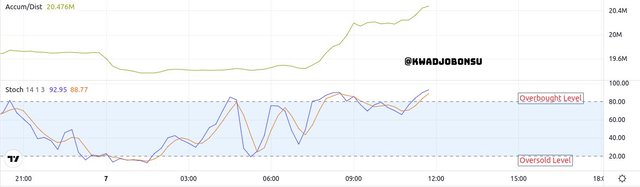
The Stochastic Indicator is an effective addition to the Accumulation/Distribution technical indicator. I select the Stochastic Indicator because it communicates when unique conditions that the A/D indicator is unable to account for. The Stochastic indicator can signal oversold assets when the reading falls between the 0 and 20 margins. This indicates the selling pressure will abate eventually, and buying pressure will build up in the market.
Inversely, when the buying pressure of an asset within a time frame reaches its peak, the Stochastic reading fall between 80 and 100. This particular range is called the Overbought level. It is followed by a bearish reversal as traders sell the assets at high prices to acquire profits. The Stochastic has a higher sensitivity than the Accumulation/Distribution indicator.
Putting the two technical indicators to test.
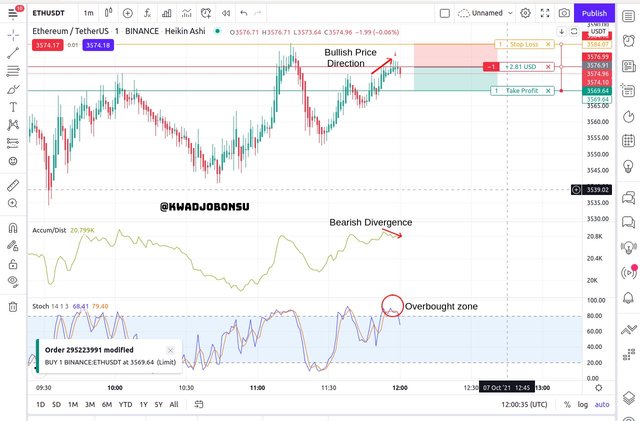
The ETHUSDT chart was selected. The Stochastic and A/D indicators were added accordingly. The divergence between the price direction and the Accumulation/Distribution indicator was identified. As the price of the asset experienced an upward movement, the A/D indicator displayed a downward movement. This means that a bearish reversal was imminent because there are not many buyers during that period to maintain the bullish price direction. In the same manner, the Stochastic indicator showed that the asset was in the Overbought zone. This confirmed that a bearish reversal was close.
I opened a Sell Limit order after a bearish candle was displayed. The Stop Loss of the order was set slightly above the highest peak of the chart, and the Take Profit margin was configured to a commensurate level as the Stop Loss margin. The TPSL ratio was 1:1. A paper profit of $2.81 is seen at the time of the screenshot.
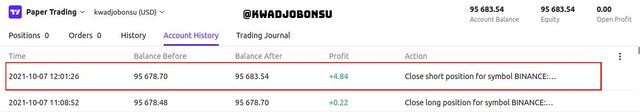
The order was closed at a profit of $4.84 as highlighted in the screenshot above.
Conclusion
The Accumulation/Distribution indicator is a good technical indicator that uses the volumes of assets to determine the nature of liquidity on the market. An upward movement signals the high buying pressure and the dominance of buyers on the market, whereas the downward movement indicates high selling pressure and that sellers are in control at that point in time on the market. It is also effective at recognizing market divergence.
In as much as the A/D indicator works, it has its flaws. Hence, traders should use it with caution. It is recommended that traders combine multiple indicators to check for confluence before making entries into the market. The appropriate risk management systems must also be put in place.
I thank Professor @allbert for this wonderful lecture.
Hello @kwadjobonsu Thank you for participating in Steemit Crypto Academy season 4 week 5.
Nice Work
Interesante el tema seguire indagando al respecto para familiarizarme aun más, ya que es un mundo nuevo para mi.