Fear and Greed Index - Crypto Academy / S4W5 - Homework Post for @wahyunahrul
.jpg)
Hello, once again friends. I believe all is well? This post is my submission to Professor @wahyunahrul's lecture on the Fear and Greed Index. The assignment was given as below:
1). Explain why emotional states can affect cryptocurrency price movements?
2). In your personal opinion, is the Fear and Greed Index a good indicator of the market's emotional state? if not, try to give reasons and examples of other similar indicators for comparison.
3). Give your personal opinion on what data should be added to the Fear and Greed Indicator.
4). Do a technical analysis for 2 to 3 days (maybe more) using the Feer and Greed Index and the help of other indicators. Show how you made the decision to enter the cryptocurrency market and explain the results of your trade (Screenshot Required)
5). Conclusion.

Explain why emotional states can affect cryptocurrency price movements?

Cryptocurrency assets are financial elements that possess monetary value. The values of these assets swing up and down during distinct time periods on the market, and what drives the volatility of these entities are the bidding and selling offers that are executed by humans on the market. These individuals primarily enter markets to make profits, and in the event that things go sideways, they do their best possible to either break even or walk away with contained losses.
Emotions are a big part of humanity and play a critical role in our decision-making processes. Likewise, market entry and exit decisions are to an extent guided by emotions. There are distinct states of human emotions, and each has its repercussion on the manner of decisions to be made. The cryptocurrency market trades have their fair share of human psychology. A strong and collective emotion experienced across board can have a severe impact on the price of a cryptocurrency asset.
The two predominant emotional states that are associated with financial asset trade are fear and greed. Fear emerges when individuals or firms discern or recognize an unfavorable market condition that can wipe out their profits as well as capital. Hence, traders and investors take precautions and act on this sentiment by selling their assets at lower prices to secure what is left. Likewise, when traders or investors are able to conclude on a potential bullish run of the respective assets, they experience greediness and hold onto their assets or purchase more on the market.
The implementation of these psychological directions affects the respective prices of the asset. As fear evokes and traders sell assets at lower prices, the price point of the cryptocurrency entity is driven down accordingly. In the same manner, when traders become greedy and purchase more assets while others also hold on to their acquisitions, the price of the assets is driven upward on the markets.
These emotions can arise out of individual speculation of the price action of assets on the chart, news on major platforms including social media, and many others. Even when traders employ technical or on-chain analysis, there is always an emotional contribution to the final decision that was made.

In your personal opinion, is the Fear and Greed Index a good indicator of the market's emotional state? if not, try to give reasons and examples of other similar indicators for comparison.


Created by CNNMoney, the Fear and Greed Index is chiefly tool traders and investors utilize to gain a good gauge of the sentiment level of a cryptocurrency asset on the market. This tool relies on the principle that the two emotions fear and greed are predominant emotions responsible for the volatility of cryptocurrency assets. Fear, as already established, causes price decline of the financial entities, whereas greed makes the price of assets soars.
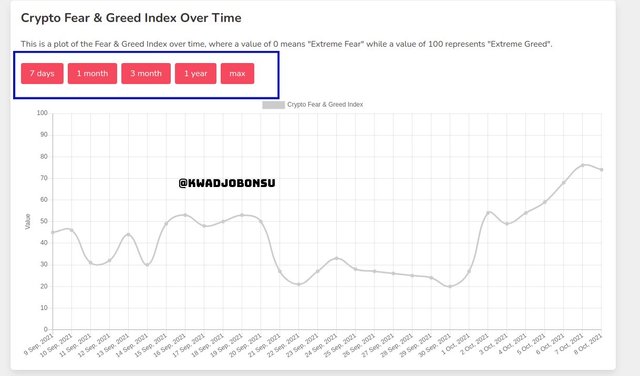
The Fear and Greed Index has a numerical boundary that is relevant in assessing the emotional state of an asset’s market. The lowest score for the index is 0. while 100 is the highest possible score. These scores have ranges that indicate a distinct form of sentiment that is perceived at work.
The score range of 100 to 75 is regarded as Extreme Greed, and the boundary of 74 to 51 is classified as Greed. The 50th mark is considered a Neutral point and numbers below it denote different forms of fear. 49-25 communicates Fear, whereas 24-0 translates to Extreme Fear .
These indicators are of the essence to traders because they signal advantageous market entry and exit strategies. When the index indicates Fear, it means the asset is selling an undervalued price point and hence is a good time for traders and investors to purchase the asset at such low prices. Alternatively, a Greed index signals a good time for traders and investors to sell their overvalued assets to secure their profits.
The index is able to provide these sentimental thresholds in the first place because it tracks data of different forms and of different sources collectively. One-fourth of the index data collection is based on the level of volatility of a cryptocurrency asset over a period of days, usually 90 days. The index also heavily the volume of the assets on the market as well as their level of momentum. Data is also collected from social media platforms since such information is a reliable reflection of the psychological stance of other traders, investors, and project development teams. Finally, the level of a cryptocurrency’s dominance on the market is taken into consideration during the sentimental computation of the index.
Some merits of the Index include an ample accuracy level with regards to the kind of data it provides. Also, the respective threshold and their labels provide good reversal hints to traders and help them capitalize on market trends to make profits. It is also fairly simple to fathom and apply as compared to other technical indices and tools. Hence, it is a great starting place for beginners. More importantly, it highlights recent market conditions, which is a piece of useful information that traders consider before making decisions.
Despite its demerits such as its limited time-frames and lack of support for a wide range of cryptocurrency assets, the Fear and Greed Index still remains useful and relevant in the cryptocurrency trading space.

Give your personal opinion on what data should be added to the Fear and Greed Indicator.


The Fear and Greed Index needs to make its chart time frame more flexible by making shorter time periods such as minutes and hours available options. Different traders resort to distinct trading strategies. Some traders prefer scalping on the market, while others have a proclivity for a swing trade and long-term trades. The available time stamps on the Fear and Greed Index favors long terms traders and places short-term traders at a huge disadvantage.
Short-term traders like scalpers prefer analyzing hourly and minutes charts to gain a better perspective of the market conditions so that they can adjust their decisions according to make profits. However, such time-frames are not available. Hence, the addition of such data will be of great benefit to all traders and investors.
Additionally, the Fear and Greed Index only provides readings for the Bitcoin cryptocurrency. This is a big blow to the cryptocurrency space considering the availability of over 12000 cryptocurrency assets on the market. Not all traders and investors make profits off the market conditions of Bitcoin. Some prefer Altcoins and other tokens. Hence, the introduction of more cryptocurrency assets within the Fear and Greed Index database will prove valuable to traders and investors across the world.

Do a technical analysis for 2 to 3 days (maybe more) using the Feer and Greed Index and the help of other indicators. Show how you made the decision to enter the cryptocurrency market and explain the results of your trade.


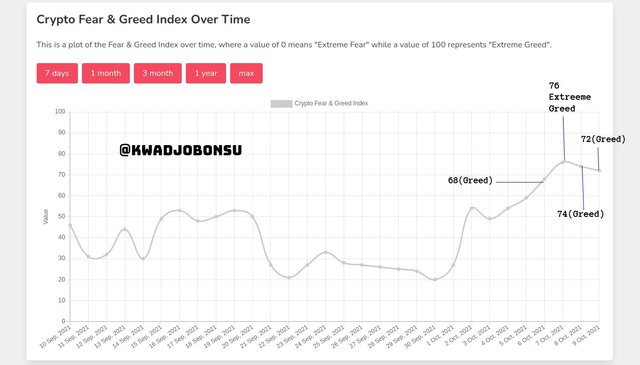
- A look at the last four days index of Bitcoin indicates that it has been in the Greed zone for those number of days. On 6th October 2021, the Fear and Greed Index was 68, which indicated Greed. 7th October 2021 was quite different as it entered the Extreme Greed zone. The reading later fell back to the Greed zone with values of 74 and 72 in 8th and 9 October respectively. These values all indicated that Bitcoin is currently overvalued, and hence a bearish reversal is imminent.

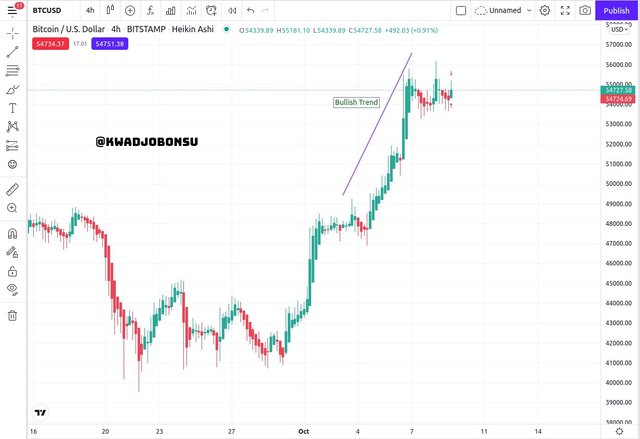
- The trend was confirmed using the Tradingview platform. The BTCUSD chart was select, and indeed over the last four days, the price point of Bitcoin has been in a bullish fashion, indicating the dominance of buyers on the market.

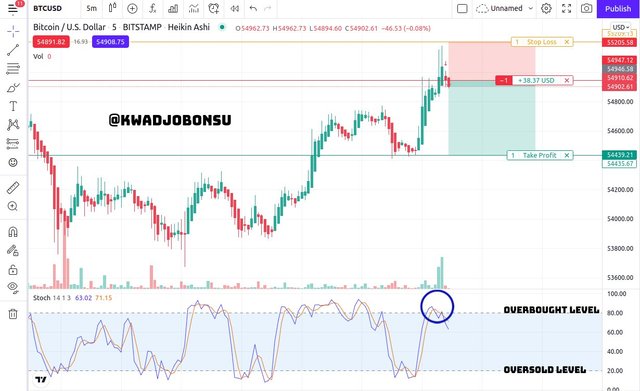
- With a different time frame and the integration of the Stochastic indicator, I was able to identify a selling opportunity as the Stochastic indicated that BTC was overvalued due to its presence in the Overbought zone. I waited for the reversal to commence before entering the market. The reward to loss ratio for the TPSL element was 2: 1.

- The order was finally closed with a profit of $72.42 as highlighted above. I used the paper trading account on Tradingview for this trade.

Conclusion

The psychology of humans plays an important role in the market. The sentiments of traders can lead them to arrive at decisions that can drive the price point of an asset up or down on the market. The fear of missing out on a bullish run as well as greed can cause traders to purchase a large number of cryptocurrency assets and hold onto them, whereas a violent bearish direction of price over a time period can evoke a sentiment that leads these traders into selling their assets to secure profits or what is left.
The Fear and Greed Index does a good job of measuring the sentiment level of the Bitcoin market. However, the Index needs to incorporate more cryptocurrency coins and also present more flexible time stamps so that the needs of traders with various styles can be met.
I am grateful to Professor @wahyunahrul for this lecture.