Technical Analysis Strategies for Crypto Trading.
It feels super exciting to be back on the SteemitCrytoAcademy, participating in this week's task. Special thanks to the teachers for all their effort. So, on this post i will be attempting the task challenge on technical analysis, i will be writing about the principles of technical analysis and key tools, how these indicators can be applied, develop a good technical strategy and lastly talk about a real-life scenario.
Question 1: Foundations of Technical Analysis
Explain the principles of technical analysis in cryptocurrency trading. Discuss key tools such as trend analysis, support and resistance levels, and chart patterns, with examples relevant to the Steem/USDT market.
Understanding the foundation of technical analysis is very important for traders to survive in the cryptocurrency market, this just means that technical analysis is a very important tool when a trader wants to predict the movements of price which can be based on historical data. Technical analysis is also based on patterns and indicators that helps a trader make informed decisions when trading. Now what are the core principles of technical analysis? Technical analysis works on the following principles:
- Price Discounts Everything: Every information that a trader needs on the technical analysis, market prices reflects all of that, even the market sentiment.
- Prices Move in Trends: Market does not move randomly, rather its moves with a noticeable trend that a trader can identify over a period of time.
- History Repeats itself: collective human psychology has made the market patterns occur again making history repeat itself sometimes.
Now, there are key tools that can help a trader when trying to understand the technical Analysis, they are as follows:
- Trend Analysis: this just tells the movement of trends, it can be upward, downward or sideways. For instance, Steem/USDT saw an uptrend in early 2024, that caused a consistent highs and lows, this happened after the consolidation phase of the market trend.
- Support and Resistance levels: these are important price levels where the pressure of buying and selling influences the market movement.
- Chart Pattern: chart patterns can be in the form of head and shoulders, triangles or double tops/bottoms, these helps the trader make predictions of market movements.
Question 2: Applying Indicators for Decision-Making
Using historical Steem/USDT data, demonstrate how to apply a technical indicator (e.g., RSI, MACD, or Moving Averages) to make trading decisions. Provide a practical example with entry and exit points.
Applying Indicators is very crucial when traders tend to want to make informed decisions. Using the RSI Indicator helps the trader carry out informed decisions. RSI also known as Relative Strength Index is an Indicator that measures the price momentum between 0 and 100. So if the movement is above the 70 mark, it means there is an Overbought and it tells traders that there is a potential sell pressure, but if the movement is below the 30 mark, there is an Oversold, alerting traders about the buy opportunity.
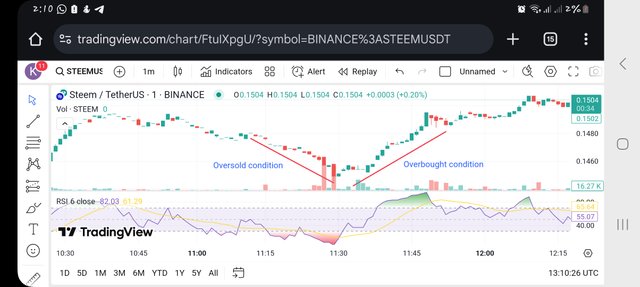
From the Steem/USDT chart above, at the green area of the RSI, you can see that it exceeded 75 which signals an overbought condition increasing steem price from $0.1442 to $0.1481. Also, the red area on the RSI, you can see that it fell below the 30 mark, indicating an oversold.
Question 3: Utilizing Chart Patterns
Analyze how common chart patterns like triangles, double tops, and head and shoulders formations influence trading strategies. Use a chart to illustrate how these patterns help identify market trends.
There are common Chart Patterns that can be used by traders to gain more insight on how the market trends moves. Below are the chart patterns:
- Head and Shoulders: When the market price is moving at a bearish reversal pattern and a neckline break occurs, this just confirms a trend change, helping the trader implement the necessary precautions.
- Triangles: it can be in an ascending, descending or symmetrical form, when it is ascending, it means there is bullish continuation and when there is a bearish breakdown, it is suggested to be descending.
- Double Tops/Bottoms: when we have a double tops, it signals a reversal downward and double bottoms signals an upward movement.
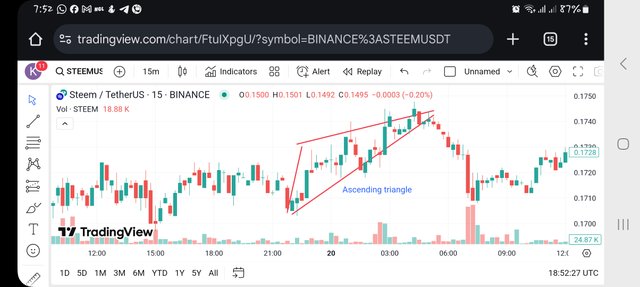
From the above chart, we can see the ascending triangle, showing that there was a breakout above the $0.1712 which led to a surge towards $0.1746 confirming that as a bullish pattern.
Question 4: Developing a Technical Strategy
Design a trading strategy for Steem/USDT that incorporates multiple technical indicators. Explain how your approach adapts to different market conditions, such as breakouts, consolidations, or reversals.
For a trader to be able to develop a successful trading strategy for Steem/USDT, he has to be able to combine some good indicators that can assist him get a better accuracy. Now, indicators like RSI, moving averages and Support/Resistance can be a good combination. Following the steps below gives a good strategy:
Step 1: Identify the market trend with the Moving Averages (MA): Use a moving averages of 50-day and 200-day, if the 50-day moving average crosses over the 200-day moving average showing the golden cross in an upward trend, that signals a bullish movement. likewise, if there is downward cross over, showing the death cross, that signals a bearish movement.
Step 2: Confirm the Entry points using the RSI: this enables the trader to look out for patterns of overbought or oversold so that the trader can validate his trading decisions.
Step 3: Setting the Entry and Exit points using Support and Resistance: these levels help to define where the trader can place the entry and exit point. Now, when the RSI is below 30 and the price of Steem/USDT is near the support level, this indicates a Buy, but when the RSI is above 70 and the price is near the resistance level, that indicates a Sell.
Lastly, Incorporating a Risk Management that is, placing a Stop-loss would help to protect the trader against unexpectedly market movement.
Furthermore, for the above strategy to be successful, it has to be able to adapt to some market conditions and these market conditions are as follows:
- Breakouts: a position where by the trader is able to confirm price before entering a trade.
- Consolidation: the trader is able to notice when the prices are moving sideways so as to avoid trading at that time..
- Reversals: Before the trader goes ahead to commit to a trade, he should be able to confirm trend changes with multiple indicators.
Question 5: Lessons from Real-Life Scenarios
Discuss a real-life or hypothetical scenario where technical analysis played a critical role in a trader’s success or failure. Reflect on key takeaways to improve future strategies.
A very crucial example where technical analysis has played an important role in helping traders make trading decisions is in the early 2024 (Bitcoin's rally). Bitcoin experienced a surged where it raised from $42,000 to $50,000, the RSI reading was above the 75 mark and the MACD was divergence, these just warned that there was an overbought in the market. Traders that leveraged on that signal were able to secure some profit before the correction went back to $45,000.
In May 2024, There was a similar scenario in the Steem/USDt market. Traders anticipated a breakout to occur above $0.38 when they noticed the market price had formed a symmetrical triangle. Due to the low volume confirmation, the price reversed quickly after the surged so traders that didnt consider volumn before entering suffered some losses while those that implemented the risk management minimized damage.
Some key takeaways from the above scenario:
- Traders need multiple indicators to help them make better predictions.
- Make sure to consider the volumn analysis for better confirmation on breakout patterns.
- Always implement the Stop-loss orders for them so as to protect thir asset against market fluctuations.
- Refine the market strategies as time progresses and adapt to the market condition changes.
- lastly, traders can improve in their decision-making and risk management by learning from their past experiences.
Conclusion
In the cryptocurrency market, it is very crucial that traders leveage on technical analysis like trends, patterns and indicators for them to be able to make informed decisions, also for them to expect high success rate, continuous adaptation to market conditions will definitely help.
All Imagines were screenshot by me
Thanks.