Crypto Academy Season 3 Week 8|| Homework Task For @cryptokraze--Trading Sharkfin Pattern.
Hey everyone, i am glad to be participating in this week's homework task by @cryptokraze. It was a simple and well explained lecture, i will go ahead to attempt the home work task.
What is your understanding of Sharkfin Patterns. Give Examples.
Sharkfin Pattern is a reversal pattern that is seen to form a V Shape pattern when moving in the downwards trends and an Inverted V shape pattern when moving towards the upward trend. This occurs mostly at the bullish or the bearish area of the chart. This V shape pattern is formed as a result of traders adding more volume in to the market, that is, creating a strong entry and the quick reversal which forms the inverted V shape as a result of an oversold by traders in the market, that is, creating a liquidity level with the price movement. This reversal pattern works best with some indicators like the RSI.
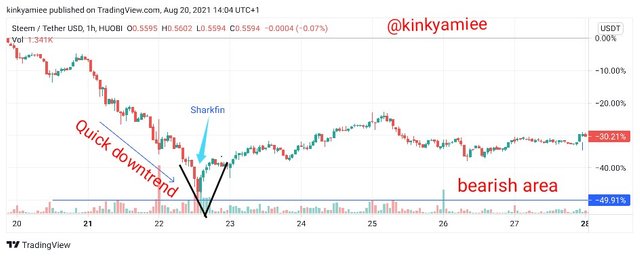
Lets take a look at a quick example of the STEEM/USDT 1hr time frame Chart. We can see that the Sharkfin patterns looks like a V shape and the reversal is moving in an upward trend. This illustration shows that the Sharkfin reversal pattern occurred at the support level of the chart.
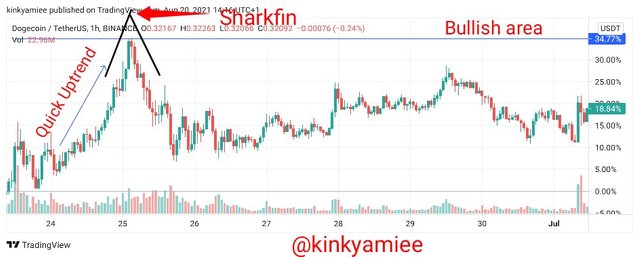
However, we can also see the DOGE/USDT 1HR time frame Chart. The Sharkfin patterns looks like an inverted V shape and the reversal is moving in the downwards trend. This shows that there was a quick movement of price towards the bearish area, hence, the Sharkfin reversal pattern occurred in the resistance level of the chart.
Implement RSI indicator to spot sharkfin patterns.
The RSI has shown at a high level how best it works with the sharkfin pattern, it has been recommended because it helps to enhance the trading experience of traders when they use the sharkfin pattern. This is usually achieved when the length of the RSI indicator is set at 14 and a default setting of the bands at 30 and 70 respectively.
Now, when combining RSI and sharkfin pattern in an Uptrend case, the RSI indicator should be seen going below the 30 RSI band which simply means that the market price is at its oversold level and then at the same time quickly reverse forming a V shape pattern above the 30 RSI band.
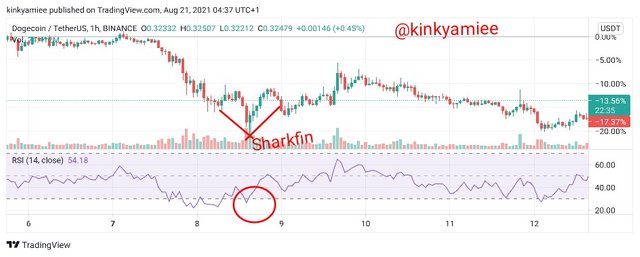
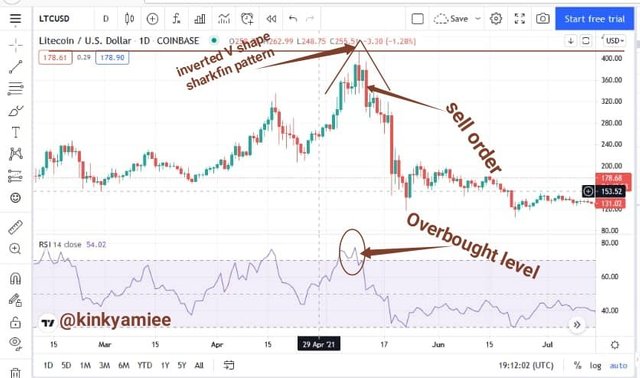
For scenarios where we have price trend heading bullish and towards the RSI band 70 level and probably crosses above it to the overbought zone, there are potential tendency of a sharp reversal which would result to an inverted V-shape structure which represents the Sharkfin Pattern. See screenshot below for better representation;

Write the trade entry and exit criteria to trade Sharkfin pattern
For this task, i will go ahead to show and explain the trade entry criteria on the chart for both the buying and selling points. Combining RSI and Sharkfin pattern, below is the criteria for the Buy and Sell case.
Buy Order Entry Criteria
On the Chart, the RSI indicated should be added so as to get the best points.
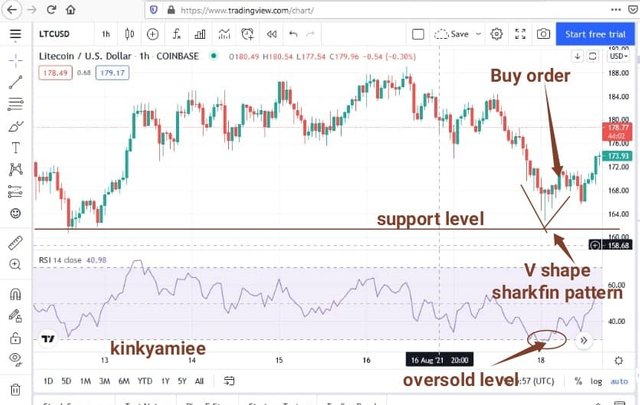
Allow the price to move in to the bearish area that is below 30 RSI level and quickly take a reversal forming a V shape pattern.
Make sure that the RSI indicator has clearly crossed below the 30 level and has also reversed back above the 30 level quickly.
Once that has been observed, the Buy order can be placed when the RSI level is clearly above the 30 level.
Sell Order Entry Criteria
On the Chart, the RSI indicated should be added so as to get the best points.
Allow the price to move in to the bullish area that is above 70 RSI level and quickly take a reversal forming an inverted V shape pattern.
Make sure that the RSI indicator has clearly crossed above the 70 level and has also reversed back below the 70 level quickly.
Once that has been observed, the Sell order can be placed when the RSI level is clearly below the 70 level.
Sharkfin Trade Exit Criteria.
The Stoploss and the Take profit prices are very important when placing a trade exit order for both Buy and Sell points. So i will go ahead to explain the criteria for them.
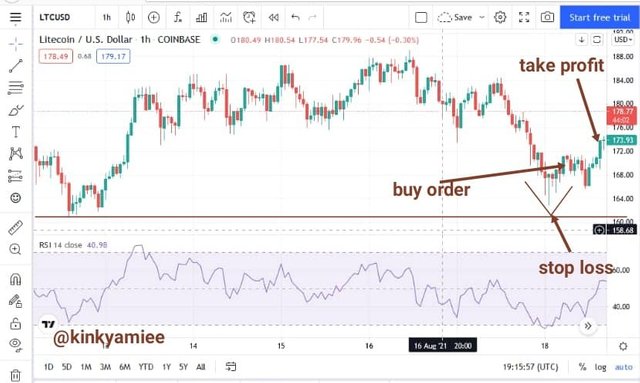
Buy Order for Trade Exit
The Stoploss level should be set just below the low point of the swing of the sharkfin pattern in case there is wrong movement after placing the order.
The Take Profit should also be set at an equal level as the Stop loss, that is, 1:1 Risk/Reward level in case the price moves in the wrong direction.
We exit the trade and wait for another setup if the price crosses the Stoploss level and becomes invalid.
We can also take profit and exit a trade of the price movement touches the set Take Profit.
Sell Order for Trade Exit
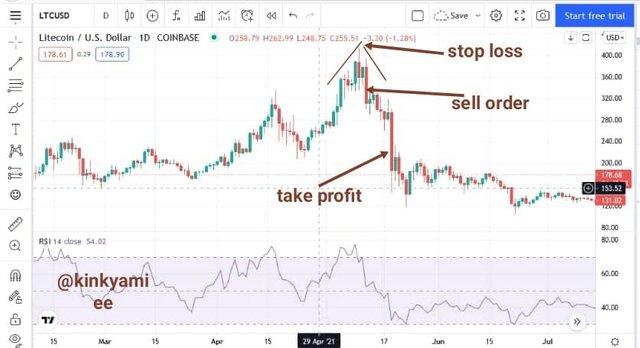
The Stoploss level should be set just above the high point of the swing of the sharkfin pattern in case there is wrong movement after placing the order.
The Take Profit should also be set at an equal level as the Stop loss, that is, 1:1 Risk/Reward level in case the price moves in the wrong direction.
We exit the trade and wait for another setup if the price crosses the Stoploss level and becomes invalid.
We can also take profit and exit a trade of the price movement touches the set Take Profit.
Thanks.