Crypto Academy / Season 3 / Week 1 - Homework Post for Prof. @kouba01: Ichimoku Kinko Hyo Indicator- Part 1.
I am so excited to be part of the season 3 of the Crypto Academy Homework Task. I want to specially thank @kouba01 for this well detailed lecture, its my first time learning about this indicator and i am going to be writing my homework task below.
1. What is the Ichimoku Kinko Hyo indicator?
Before the late 1980s, Applications were known to be formulated by Statisticians or mathematicians, not until in the late 1980s when a Japanese newspaper writer known as Goichi Hosoda created an all-in-one indicator called Ichimoku Kinko Hyo Indicator. This indicator is commonly used on the JPY pairs. It is basically used to show the future price movement of an asset and also create a higher probability trade for a trader or investor. In other words, This indicator can be used to show trends, resistance and supports, and other price behaviour of an asset over a period of time as long as the asset is tradeable. However, this indicator can not be used when there is no existence of a clear trend that is, when the price of an asset is moving at either sides of the cloud or the market is choppy.
From the Japanese words, Ichimoku means "an instant look", Kinko means "balance" while Hyo means "Chart" and all joined together means "an instant look at the balance chart". Now, the idea behind this indicator is that, at an instant look at the chart, you can identify the trends and price movement of an asset and also identify how the price comes to a balance over a period of time before it continues on its trend. So a trader or an investor that understands the lines of this indicator can possibly know when a downtrend market moves on a reverse trend and comes back to its balance showing the resistance and support levels to be able to continue on its trend.
Features of this Indicators.
- The Ichimoku indication makes it easy for a trader to make a decision on the price of an asset by marking out the support and resistance levels of a trend for the trader.
- This indicator completely works on its own, it does not necessarily need to be combined with another indicator to show its result.
- Adding the Indicator to the chart is very straight forward and easy.
What are the different Lines of the Ichimoku Indicator.
The lines on the Ichimoku Indicators are very important when using the chart, they are also known as the components of the Indicator and i will be explaining them briefly.
Kijun-sen (Red line): This is known standard line or the slow line which shows the volatility of price. It is calculated by averaging the highest high and the lowest low over the past 26 weeks. It is use to confirm the change of trends and also used as a trailing Stop-loss point.
Tenkan-sen(Blue line): it is also known as the turning line or the fast line which is also used to indicate the fluctuating price of an asset. It can be derived by adding the highest high and the highest low and dividing them by two over the past 9 periods. It is a key in the resistance and support levels.
Senkon Span A(light green): this is the leading Span A and it is calculated by averaging the Tenken-sen and the Kijun-sen which is plotted 26 periods ahead. The resulting line creates one edge of the Kumo which determines the future areas of the support and resistance.
Senkon Span B(light red line): This is also the leading Span B and it is derived by adding the highest high and lowest low and dividing by two over the past 52 periods. The line is plotted 26 periods ahead and forms the other edge of the Kumo which also determines the support and resistance.
Chikou Span: this is also known as lagging line, it indicates the closing price plotted over the past 26 trading days. This enables a trade view how the prices are compared over those 26 days. It is also used for the comfirmation of trends, resistance and supports level, and momentum shown by the other components of the Ichimoku indicator.
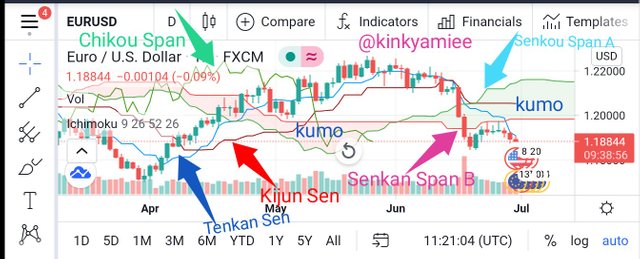
figure 1: Components in the indicators.
2. How To Add The Ichimoku Indicator To The Chart.
Adding the Ichimoku Indicator is quite simple and i have stated the steps to doing that below with screenshots.
- Goto to the Tradingview Chart page.
- Click on the Indicator icon.
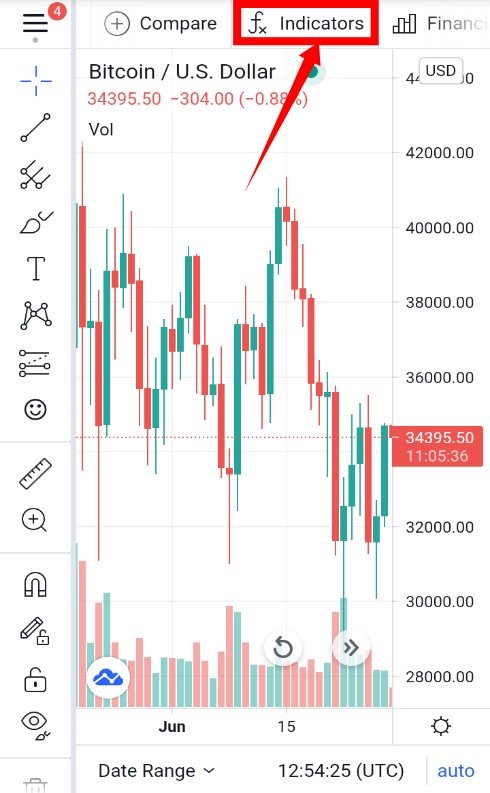
- This takes you to the Built-ins where you can find other indicators.
- Move down to find the Ichimoku Cloud.
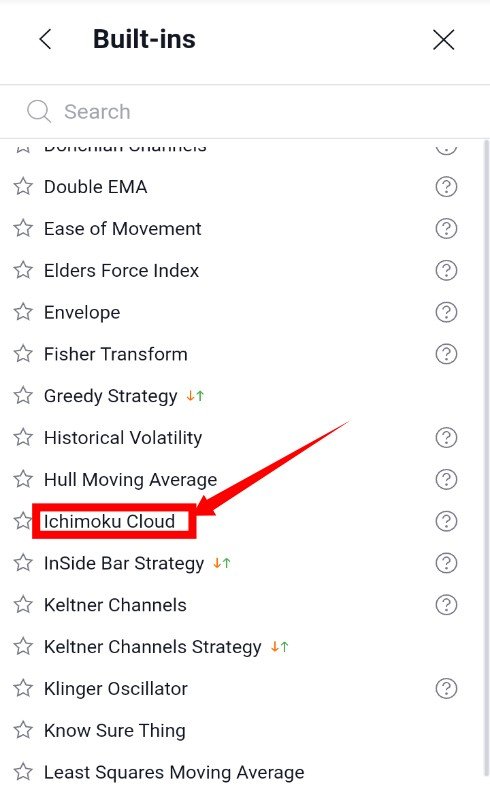
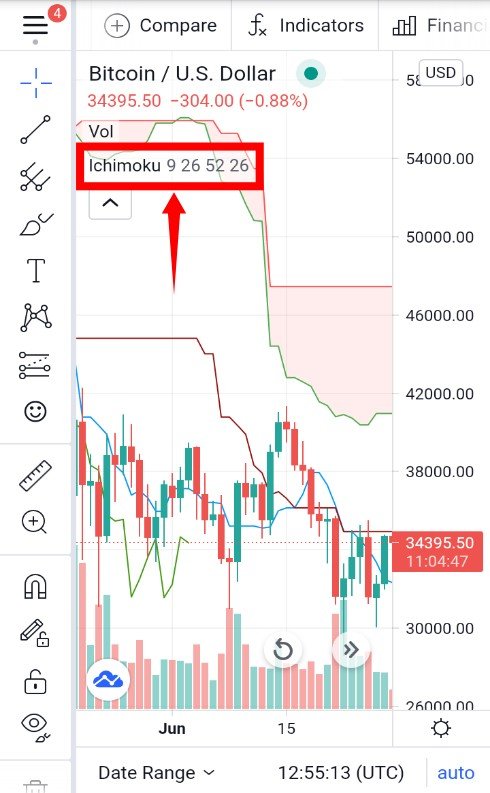
- Click on it and then go back to the front page, the five components of Ichimoku is then seen on the chart.
What is the default settings? And should it be changed?
Every technical indicator have a default setting added by the inventor and the Ichimoku Indicator is not left out. This default settings can be found in the settings area which includes the Inputs and Style.
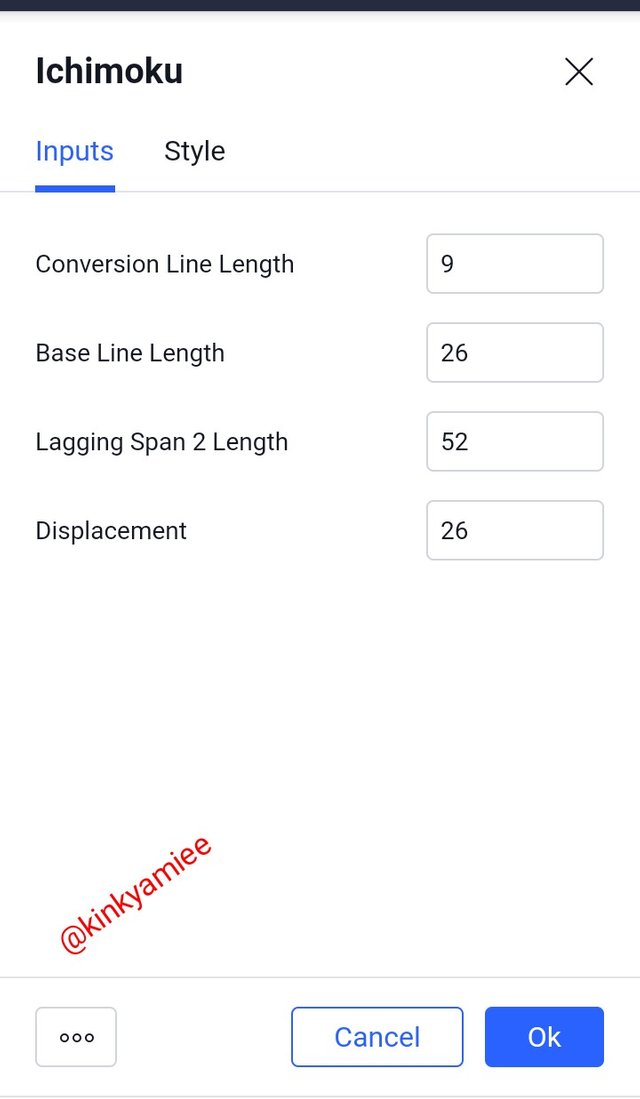
Inputs.
In the Input section, you will see the Length or Period of each lines of the indicator. The parameters found here are:
Conversion Line Length (Tenkan Sen): 9
Base Line Length (Kijun Sen): 26
Lagging Span 2 Length (Chikou Span): 26
Displacement (Senkou Span A &B): 52 & 26.
Traders study all that before making a decision on trading. From the screenshot above, it is known that the default settings for Ichimoku cloud is (9, 26, 52, 26) because they regard Saturdays as a full working day so 9 stands for a week and half of trading days (6 + 3), 26 represents the number of trading days in a month excluding Sundays and lastly 52 which equals two months of trading days.
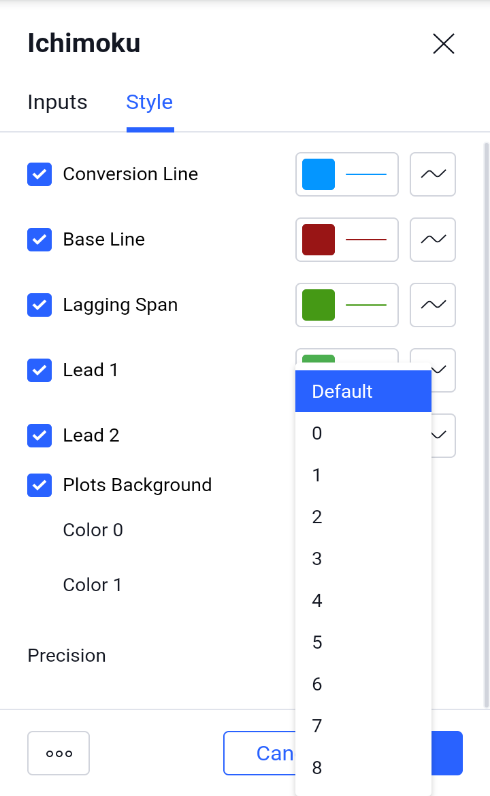
Style.
The style section contains the various colours of the components of the indicator. Here the colours of the lines can be change to whichever one suits the chart and also there Precision which is set at default, this can also be changed to the individual's preference.
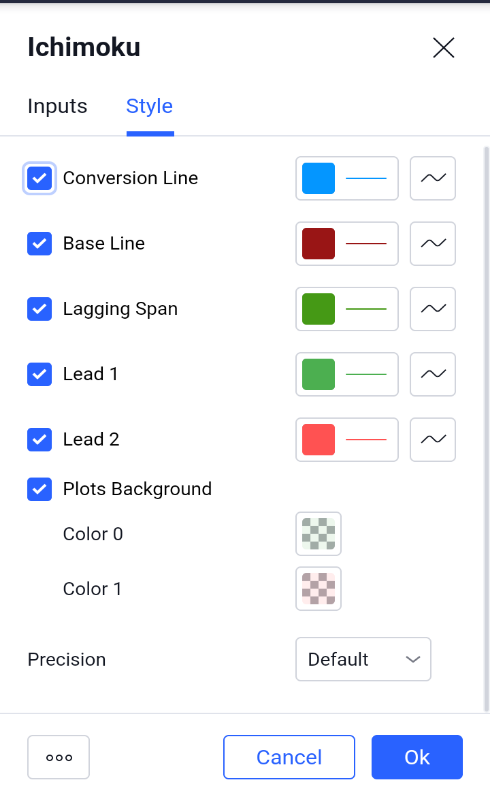
Default settings of the Ichimuko Indicator.
However, i feel like the default settings should be changed because the cryptocurrency market is open for 24/7/365 and because of the recent Price behaviour, though one has to understand the length and colors of the lines before changing the settings. The default settings should be changed to (20, 30, 120, 60) where 20 stands for a week and half including Sundays (7 + 3 = 10) which when doubled gives 20 to extend the trend capturing, though there might low volume on Sundays but then, its still counted as a trading day. 30 represents the number of days in a month while 60 days for 2 trading months. Though some traders might reject this settings but then there is no hurt in trying it out.
3. How to use the Tenkan Sen line?
The Tenkan Sen line is known as the fast line of the Ichimoku Indication and it measures the fluctuation of prices over a short term period. It is used to identify the trend of an asset on a chart pattern and this enables a trader determine the support and resistance point on the chart. Tenkan Sen also helps an analyst determine when an asset is moving in the bullish trend or bearish trend, so as to enable him/her make a decision on the asset's price. The Tenkan Sen line work best with the Kijun Sen line to give a more understanding result.
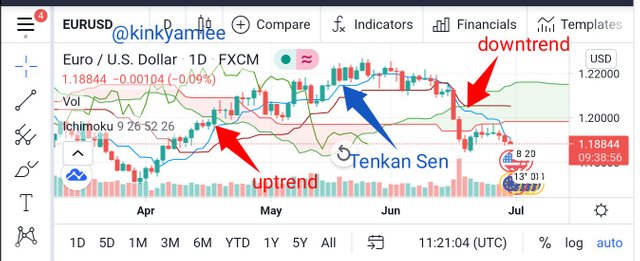
As you can see from the screenshot above, the Tenkan Sen line shows the uptrend and downtrend movement of the asset and this line moves closely with asset price.
How to use the Kijun Sen line.
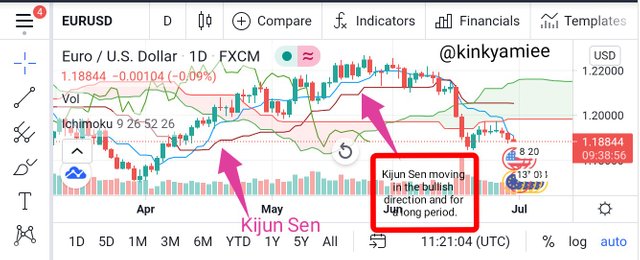
The Kijun Sen line is known to be the slow line or the base line, it determines the volatility of the price of an asset over a long term or period. It is derived by averaging the highest high anf the lowest low over a period of 26. It is used as a trailing Stop-loss and also use to confirm a trend change. For instance, if the Kijun Sen line moves in the bullish direction, there is a tendency of it continuing in that trend for a long period like wise when it moves in the bearish direction.
How to use them simultaneously?
Understanding the indicator is made easy when the Tenkan Sen and Kijun Sen lines are used simultanously. They work best together and this gives a clearly picture to the analyst enabling him know when to exist or enter the asset's market. Now when the Tenkan Sen line crosses the Kijun Sen line into the bullish direction, it indicates that trader is at a safe point to buy an asset at that period, just as the screenshot shows below.
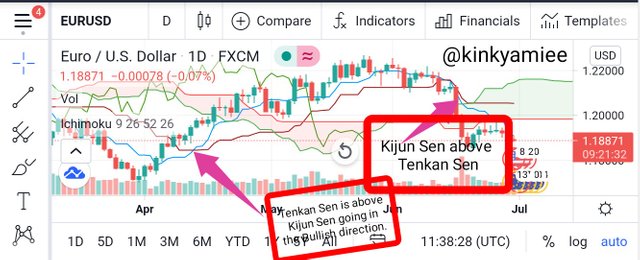
Likewise , if the Kijun Sen line crosses the Teknkan Sen line in the bearish direction, it indicates a sell position.
4. What is the chikou span line? And how its use.
The Chikou Span is one of the components of the Ichimoku Indicator. It is also known as the lagging line. It is the closing price plotted over the past 26 trading days and it provides the view of how the prices are compared between the 26 days. Now when Chikou Span is above the closing prices, it indicates that the trend is moving to the bullish direction which is an uptrend and when it is below the closing price, it moves to a downtrend direction. So this line gives a clearer view to the trader when the trader uses the current chart rather than the historical data of the asset. The Chikou Span is used for comfirming a trend, support and resistance levels and also the movement of trends highlighted by other Ichimoku elements.
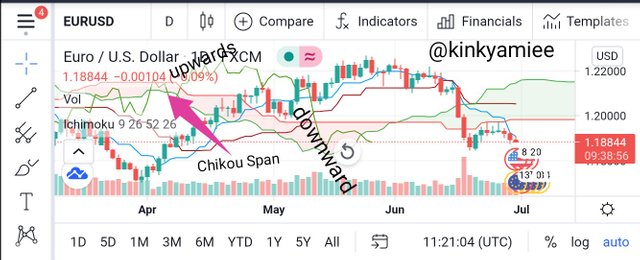
Chikou Span on the chart
From the screenshot above, you can see that the line is crosses above in to the bullish area, this indicates that the trader is safe to buy an asset at the uptrend point
Why is it often neglected?
There are few reasons why the Chikou Span is often neglected and they are listed below.
- Firstly, The Chikou Span can send a false signal during a crossover that is, when the Chikou Span crosses the price, it might not give any meaningful trend change to follow, hence it is neglected.
- Secondly, Chikou Span does not really give any future price behaviour of an asset and thats because it only measures the closing price of an asset in 26 period, hence traders neglect it.
- Lastly, the Chikou Span doesnt enable traders make an efficient decision because it doesnt really give a meaningful result as such, it has to work with other elements of Ichimoku.
What's the best time frame to use Ichimoku?
Ichimoku Indicator can be used at any time frame. Different traders have different system at which they use this Indicator and as such, the Ichimoku Indicator can be used at any time frame based on the type of trader and system that the trader is using.
Now, if you are a short term trader, you are likely to use the indicator for a short time frame, like from 1-minutes to 6-hours and as for a long term trader, they are likely to use the indicator on a daily or weekly chart so as to enable them analyze the market for a long term. So based on that, the indicator is suitable for any type of trader.
What is the best indicator to use with it?
The Ichimoku Indicator is known to be independent because it is an all in one indicator and this enables traders to identify trends, determine the support and resistance levels and lastly the current price behaviour of an asset and even the past price action of an asset, all these can be seen in one chart.
However, the indicator still needs to combine with other technical indicator to give that precise result. The Relative Strength Index is regarded as the best paired and often paired indicator to the Ichimoku Indicator. This indicator gives traders the complete picture of the resistance and support trend an also gives a certain type of complementary approach to analyzing the market.
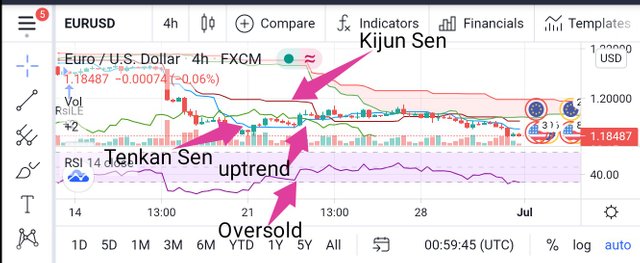
Lets take a look at the screenshot above, we see how the RSI moved into the bullish area signaling an Oversold and in the Ichimoku Indicator, it was a little bit slower thats, the Tenkan Sen line didnt cross over the Kijun Sen line on time to get into the bullish area. This just tells us that the uptrend has started before he Ichimoku Indicator dectated it. Therefore, the Relative Strength Index gives a clearer picture of the uptrend when it is combined with the Ichimoku indicator.
Conclusion.
The Ichimoku Indicator is an all in one indicator that signals a support and resistance level along with the trend direction and movement. The components of this indicator makes it easy for traders to make a trading decision. This indicator uses multiple averages to predict the trend within the market and works good with other indicator like the RSI indicator to enable traders make a decision on the price market.
Thank you for reading.
</div
Hello @kinkyamiee,
Thank you for participating in the 1st Week Crypto Course in its third season and for your efforts to complete the suggested tasks, you deserve an 8/10 rating, according to the following scale:
My review :
You have provided, through a set of correct information, good content, your writing style is great and your methodology is sound. With your permission, I would like to correct this information:
Thanks again for your effort, and we look forward to reading your next work.
Sincerely,@kouba01
Thank you Respected Prof. for the correction and review, I have taken note of the dates and history
Academic Master is a US based writing company that provides thousands of free essays to the students all over the World. If you want your essay written by a highly professional writers, then you are in a right place. We have hundreds of highly skilled writers working 24/7 to provide quality essay writing services to the students all over the World.
My articles is a family member of guest posting websites which has a large community of content creators and writers.You are warmly welcome to signup and publish a guest post with a dofollow backlink no matter in which niche you have a business. Follow your favorite writers, create groups, forums, chat, and much much more!