Crypto Academy | Season 3 | Week 2|| Homework Task For @cryptokraze.
Hello everyone, i am happy to participating in this week's Academy task on Market Structure and how it can be used during trading. I want to specially thank @cryptokraze for bringing out time to give a well detailed lecture. So in this post, i will be attempting the assignment task that has been given. So lets begin.
Understanding Market Structure.
From my own understanding, Market structure is a trend following tool or chart that shows the movement of price of an asset, in other words, it basically shows the support and resistance levels of price, the swing high and swing low. Market Structure is most times referred to as Price Action because of how the market moves. This trend movement could be Bull trend, Bear trend or sideways trend.
This market trend moves in 3 different direction one at a time and this movement can be upwards(Bull trend), downwards(Bearish) and sideways trend and as the move, they explain the market situations which enables a trader understand how to read the market structure.
Uptrend Market Structure.
The Uptrend consist of the higher highs and the higher lows which continues in that direction except an asset price falls to a lower low. This creates a price movement in the upwards direction.
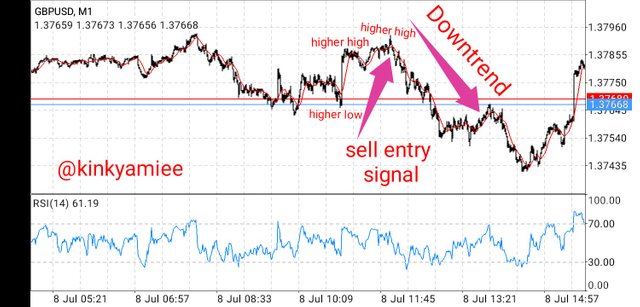
Downtrend Market Structure.
The downtrend is the price action of lower low and lower highs, this and this trend ends once the higher high comes in to the price. This creates a price movement in the downwards direction.
Sideways Market Structure.
The sideways trend has an equal highs and lows. The price created is on a resistance and support range (consolidation) until it is broken from the top or bottom which can be the beginning of the any of the above trends.

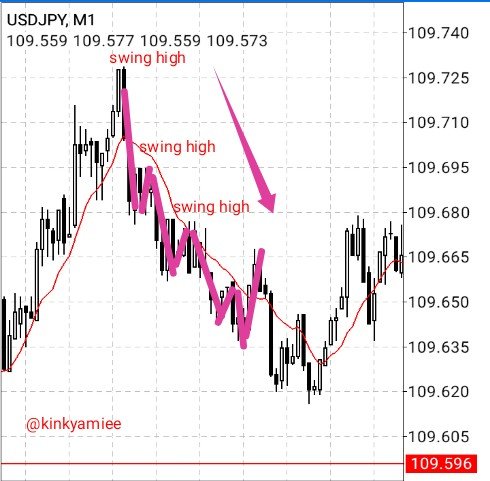
The Concept Of Highs And Lows.
When price moves in a zig-zag pattern, it create some significant points and these points are what brings about the resistance and support levels that is, the market structure. This movement gives a clear view on the direction at which the market is moving and enable the trade capitalize on it.
Just as i have stated above, these points are specifically based on the types of market structure. The uptrend consist of the Higher highs and the Higher lows while the Downtrend consist of Lower Highs and Lower Lows. I will be throwing more light on the highs and lows.
Higher High.
The Higher High is associated with uptrends in which the swing high movement occurs higher than the prior swing high point. This determines the upward price movement, hence creating an uptrend. However, it is very important that the next swing high is higher than the prior swing high to be regarded as an uptrend.
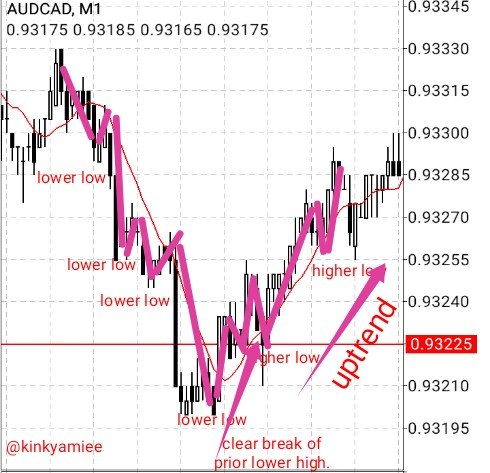
Higher Low.
This is also associated with uptrend but it is formed at the low point of an uptrend. The higher low is formed when the current higher low is above the prior low. This also shows the beginning of an uptrend.
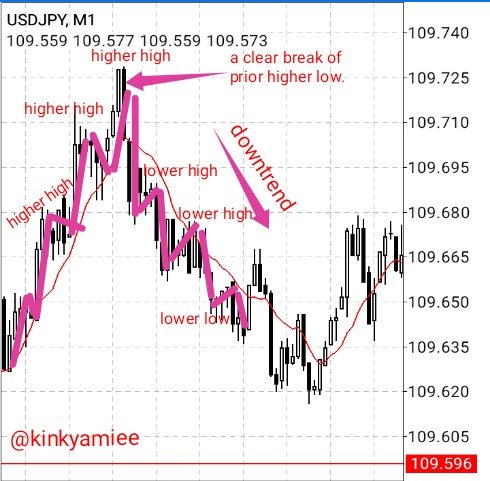
Lower Highs.
The lower high is associated with the downtrend market structure in which a swing high movement occurs lower than the previous high. This is formed from an uptrend that has lost its momentum. So if it continues in this way, there is a downtrend coming.
Lower Low.
This is also associated with the downtrend market structure and it is formed when the swing low movement occurs lower than the prior low. This determines the downwards price movement, hence creating a downtrend. However, it is important that the previous low is lower than the current low so as to avoid a wrong price action understanding.
Trend Reversal with MSB.
Trend Reversal simply means when the trend movement of an asset changes, that is when there is a break in the market structure that can favour the buyer or the seller. Now early trend reversal is associated with the formation of highs and lows in an uptrend and downtrend. So i will be throwing more light below.
Early Trend Reversal in an Uptrend.
An Early trend reversal in an uptrend is identified when there is a break of the prior higher low point, in other words, when a lower high and a lower low is formed at the top of an uptrend. This just confirms the uptrend is moving to a downtrend.
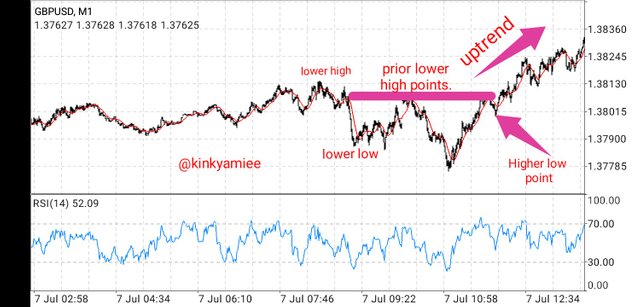
Early Trend Reversal in a Downtrend.
An Early trend reversal in a downtrend is identified when there is a break of the prior lower high point, that is, when a higher low and a higher high is been formed at the bottom of a downtrend. This just confirms that the downtrend is moving to an uptrend.
Trade Entry Criteria Using MSB.
The Market Structure Break Strategy has some rules or entry criteria that should be met or followed before going ahead to trade, this will enable a trader avoid a false price action signal. This applies to both Buy and Sell positions.
Buy Entry Criteria.
- The market should be seen moving in the downwards direction (downtrend), forming a clear lower Highs and Lower Lows.
- There should be a clear Higher low created just after the lower low.
- Make sure there a clear Bullish candle that breaks close and above the prior lower high. This indicates that the price will move upwards.
- After that, the buy trade can be taken after the bullish candle must have break close and above the lower high point.
Sell Entry Criteria.
Below are the required criteria for a sell entry using the market structure break strategy:
- The market should be seen moving in the upwards direction(uptrend), forming a clear higher highs and lower highs.
- There should be a clear Lower high forming after the Higher Highs.
- Make sure there is a clear bearish candle that breaks close and below the Lower High. This shows that the price will continue downwards.
- After that, the sell trade can be taken after the bearish candle must have broken, close and below the Lower High.
Trade Exit Criteria Using MSB.
It is very important to exit a trade at the right time and reasons for exiting a trade can either because the trade has reached it stop loss or the trade is not going in your favor a a trader. So i will be explaining the criteria for an exiting a trade.
Trade Exit Criteria When in Stop Loss.
The Stoploss is a preset price that helps to protect the trader's asset when the trade goes wrong.
Criteria.
- A Stop Loss should be set if the trade is moving away from the entry direction.
- it is ideal to place the stoploss level slight below the Higher low point in a buy trade case or slight above the Lower low point in a Sell trade case.
- Exit trade when the price crosses the stoploss level and wait for another set up.
Trade Exit Criteria When in Profit.
Take-Profit price is a preset price that helps a trader make profit when it is moving in the direction of the trade making profit.
Criteria.
- The take profit level should be set.
- The take profit level should be set at least 1:1 RR (Risk:Reward) so that its same level with the stoploss level.
- The market structure should be put into consideration when taking a profit level.
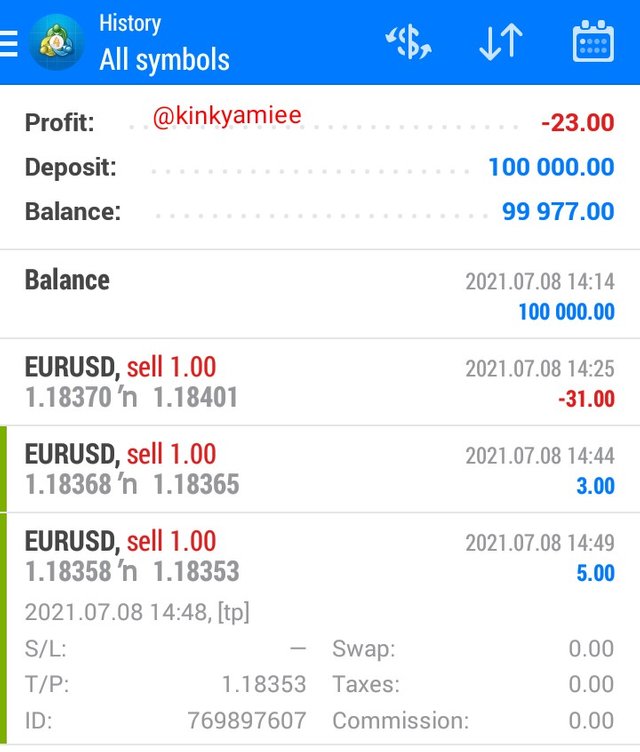
Demo Trade Demonstration.
For this demo trade, i will be using a 1- Minute chart because this is actually my first time, it was fast and easy to set up. I always used the 1:1 RR for my trade.
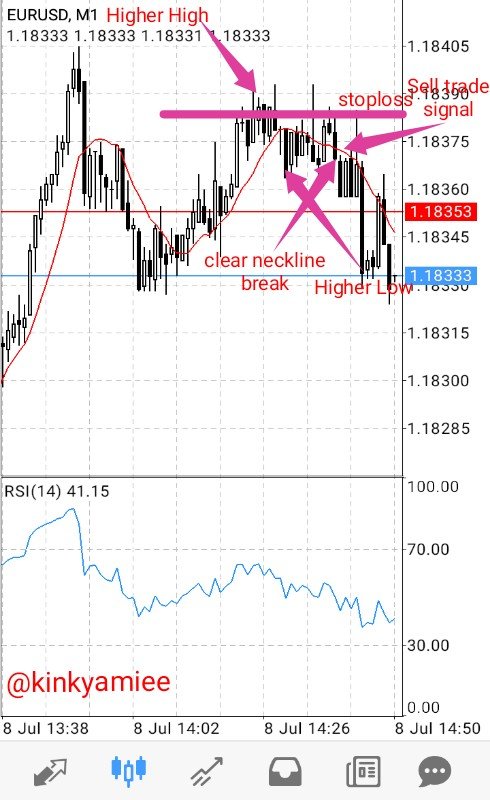
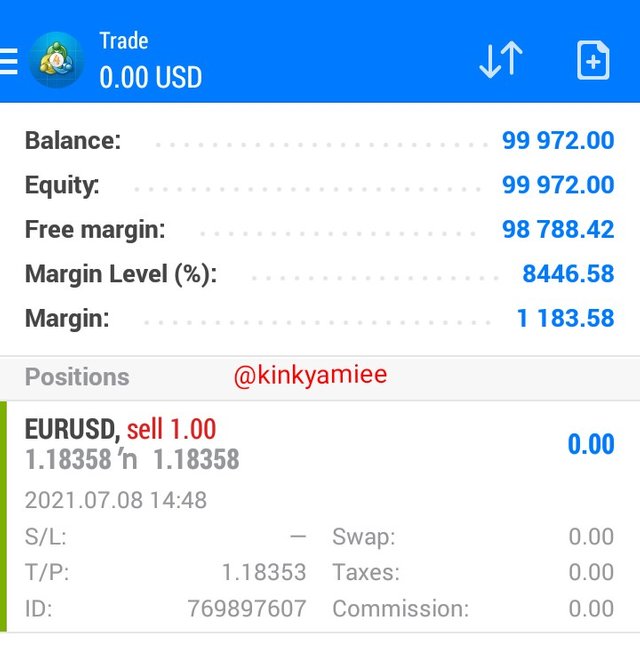
Setup 1 EURUSD
So i noticed a consistent uptrend, which was the formation of higher highs and higher lows. So i waited patiently for it to break and immediately i noticed a clear neckline, i set the stop loss and take profit. Here, i got a profit as it kept moving on a downtrend as predicted.
Setup 2 EURUSD.
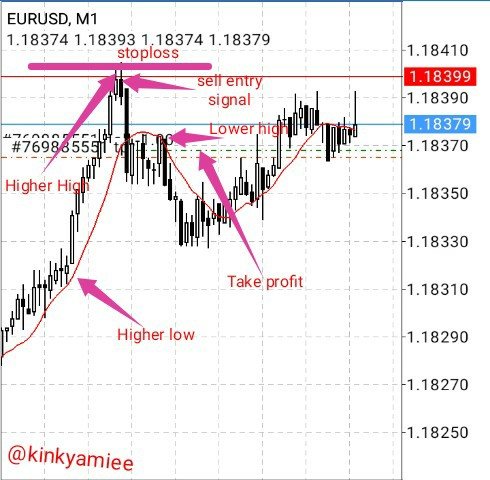
In the chart above, i noticed that there was a consistent uptrend and a formation of a lower High, so i waited patiently for other lower higs to be formed, as soon as i saw a clear neckline, i set my stop loss and take profit as you can see in the screenshot above.
Conclusion.
Finally, Market Structure is a great trend following tool that is used for trading. This is a good strategy for trader if they can understand the theory behind it.
This has opened my mind to gain more knowledge on crypto trading. And if combined with other Indicator like the RSI, it will give a better understanding.
Thank you.