Trading Using Wedge Pattern- Crypto Academy / S5W5 - Homework Post for @sachin08
 The background is from picsart and I made this design
Question 1
Explain Wedge Pattern in your own word
This time we will discuss the wedge pattern, where, this wedge pattern is one of the price channels that will narrow with two levels of support and resistance that will meet at one point. This pattern will end when the price breaks a resistance or support line and then creates a new trend.
We can see from several entries that have occurred that the price can easily retest a level that was just about to be broken and then return to create a new trend in a direction that will definitely be against the wedge itself.
As a trader we must also try to interpret a situation in a market where when a wedge pattern occurs it can be caused by market participants who will try to immediately reverse the market situation.
Question 2
Explain both types of Wedges and How to identify them in detail. (Screenshots required)
In this discussion, we certainly know that there are two types of wedges that we know, which are the Rising Wedge and the Falling Wedge.
Rising wedge
We can see this Rising Wedge pattern when a market is consolidating at a slope angle of the Support line which is a line that is steeper than the Resistance line.
So that when the price is low or the state is Low, the longer it is, the faster it will climb compared to the high value.
Although it appears at first glance that the price seems to be continuing to rise in the trend, the Rising Wedge price pattern indicates that the momentum of the upward trend is getting weaker.
If later on this pattern is formed during the Uptrend chart, then at that time the price will have the potential to reverse to plunge quickly. Meanwhile, when it is formed along a downward trend, it is likely that prices will return to continue a decline.
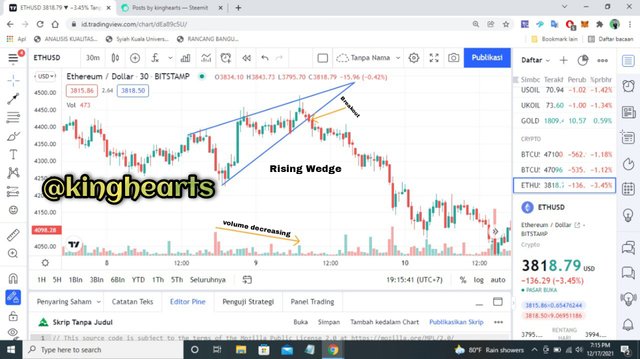 this is a screenshot of ETHUSD taken from id.tradingview.com
 How to identify the rising wedge pattern
- so first we have to draw two upward sloping lines, where these lines will intersect.
- now the second you have to make sure that the two lines have touched at least 5. Where the top line is 3 and the bottom line is 2 touches.
- now lastly look at the existing volume make sure the volume shows a downtrend
Falling wedge
Now the Falling wedge is the opposite of the Rising wedge, the pattern on the Falling Wedge is seen when the market is consolidating towards a decline with a Resistance line that is steeper than the Support line itself. So, basically the high value or High will always be faster to slope it than the value at its own low (Low).
If we see that this pattern has formed during the downward trend, then at that time the price has the potential to retaliate skyrockets. If later formed along an upward trend, there is the greatest possibility that the price will continue to continue for an upward trend.
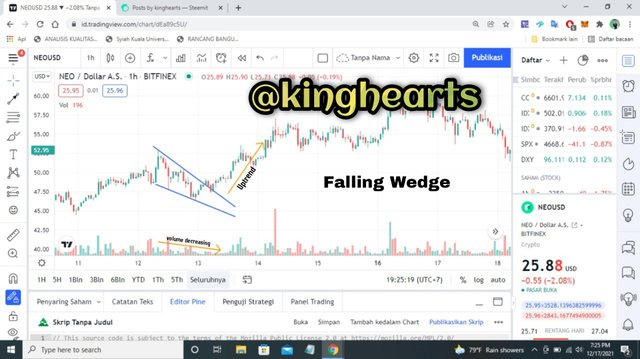 this is a screenshot of NEOUSD taken from id.tradingview.com
 How can we identify the falling wedge pattern
-Well first of all we have to draw two upward sloping lines, where the lines will intersect at the ends
The trend line at the top will connect the highest points and the trend line at the bottom will connect the lowest points. Where there must be at least two touches of each of these trendlines.
so the next thing you have to make sure that the two lines have touched at least 5. Where the top line is 3 and the bottom line is 2 touches.
now lastly look at the existing volume make sure the volume shows a downtrend
Question 3
Do the breakout of these Wedge Patterns produce False Signals sometimes? If yes, then Explain how to filter out these False signals.
This discussion is very important for me, because we as traders must always be careful in trading.
Because basically every market there will be false signals that we will get. Well now I will explain I use a Bolinga Band and Volume indicator, because I am used to using this indicator.
The indicator can also be seen clearly to detect false signals that occur, now we can see that this indicator has visible characteristics to show us where the price is going in the market through its increase and decrease, which will allow us traders to pay more attention to the existence of value in the market.
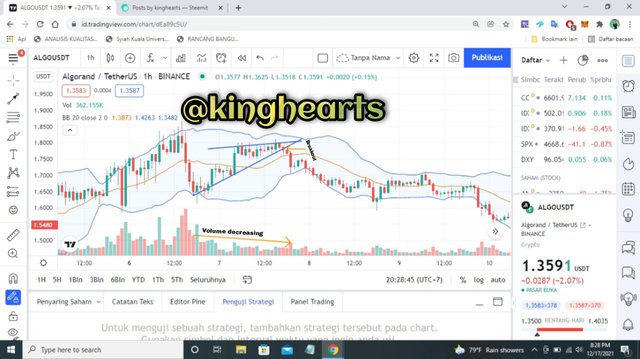 this is a screenshot of ALGOUSDT taken from id.tradingview.com
Question 4
Show full trade setup using this pattern for both types of Wedges.( Entry Point, Take Profit, Stop Loss, Breakout)
Falling Wedge trade set-up
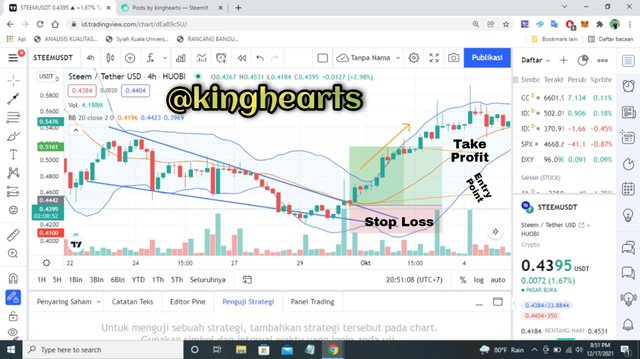 this is a screenshot of STEEMUSDT taken from id.tradingview.com
 It can be seen from the image dl uploaded above, that there has been a falling wedge and also formed at the bottom of the trend which is called bearish. The price on the trend seems to continue to touch the resistance and also touch the trendline support. And after a while it looks like the price will break the trendline resistance.
At the time of breaking the line on the resistance trend, that is where the trade entry will be made. The stop loss will also be placed slightly below the support line. Orders for take profit will also be set later by measuring a wide visible distance between the support line and the resistance line.
Setting up a Trade using the Rising Wedge
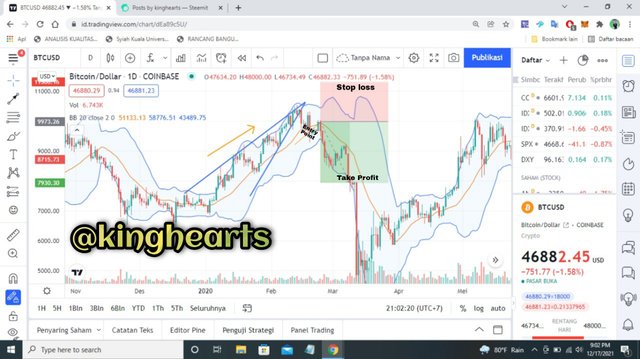 this is a screenshot of BTCUSD taken from id.tradingview.com
 The image uploaded above has several trade setups on a full rising wedge. We can also see how the price continues to bounce back on a touch of dynamic reasstance and also on the support trend line.
You can see that there were several touches on the trend line before the price then the trend broke to the bottom. Entry orders can also be placed immediately after the break of the support trend line, with a stop order for a slight loss and above the resistance trend line. Then the take profit order will also be set immediately. The distance from this start and from the two trendlines has also been measured to get a target on the market.
Question 5
Conclusion
I really thank prof @sachin08 for giving me a very useful knowledge this week. At this meeting, I understand a little more about what I will write about an assignment, because I often encounter the Falling wedge and Rising wedge trend patterns. Thank you very much Prof. @sachin08 for the knowledge, hopefully next week my knowledge will quickly increase again about things that I have not learned.
Thanks For Visiting My Post
Best Regards
@kinghearts