Steemit Crypto Academy Season 5 Beginner Course - // Task 10: Candlestick Patterns by @kenneth00

Image created by me @kenneth00 in canva
INTRODUCTION
Greetings to every one in steemit reading this post, I am here to submit task 10 of the steemit crypto academy introductory post given by our creative professor @reminiscence01 and i will be answering the (1st) question for task 9 on the topic "CANDLESTICK PATTERNS"
1a) Explain the Japanese candlestick chart? (Original screenshot required).
b) In your own words, explain why the Japanese Candlestick chart is the most used in the financial market.
c) Describe a bullish and a bearish candle. Also, explain its anatomy. (Original screenshot required)
1a) Explain the Japanese candlestick chart? (Original screenshot required).
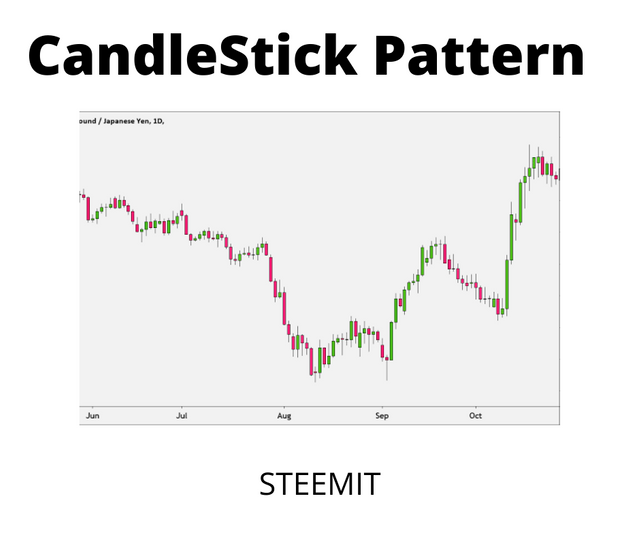
Image created by me @kenneth00 in canva
In the world of trading, the candlesticks or Japanese candlestick chart is one of the most used tools, this is because it shows us how a financial asset evolves over a period of time, based on past financial patterns; It is represented by a series of candles and each of them shows us in a simple way the price movement during the selected period of time, each candle is made up of opening data, closing data, maximum price and minimum price, so that each of these data approximates the possible movements; Candles are formed thanks to the exchange of assets between buyers and sellers and provide us with useful information by revealing important data such as:
The "what" means more than the "why", meaning that price movement is more significant than profits.
Buyers / sellers move the market based on their emotions like fear and greed.
The price reflects all the information.
The market is fluctuating.
They provide us with visual indicators that make it easier to understand price action.
Each candle is structured in three parts:
The body that is the representation of the range from open to close
The color that indicates the movement of the market is generally represented by green or white which is an indicator of a rise while red or black indicates a decrease, however the colors of the candles may change according to the user.
The shadow that shows us the ups and downs.
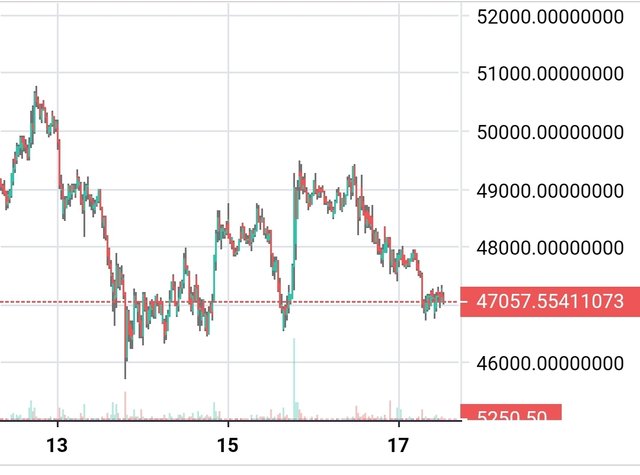
Screenshot was taken form poloniex by me @kenneth00
Japanese candles originated in the 8th century to the 1700s when the Japanese merchant Munehisa Homma realized that the rice trade was influenced by the feelings of the people involved in buying and selling this product so the price of rice Rice was affected, thanks to this interpretation Homma became the forerunner of Japanese candles, however it was not until the end of the 20th century in the 90s that this technique became known thanks to Steve Nison and his book entitled " Japanese Candlestick Tehcniques ”.
Advantages of Japanese candles
The Japanese candles provide us with information about the trend changes in turn allows a relationship to be established between the technical analysis, the fundamental analysis and the Japanese candles in this way the investor can rely and orient himself in the fundamental analysis to determine where he will make the move. investment and use technical analysis in conjunction with Japanese candles to determine when you will make the investment.
Disadvantages of Japanese candles
This type of pattern does not allow us to calculate price targets, nor does it provide us with information on overbought or oversold areas, divergences, among others; It can also generate false signals in volatile markets, so in some cases they should not be used as the only reference standard to analyze the market.
2) Explain why the Japanese candlestick chart is the most used in the financial market
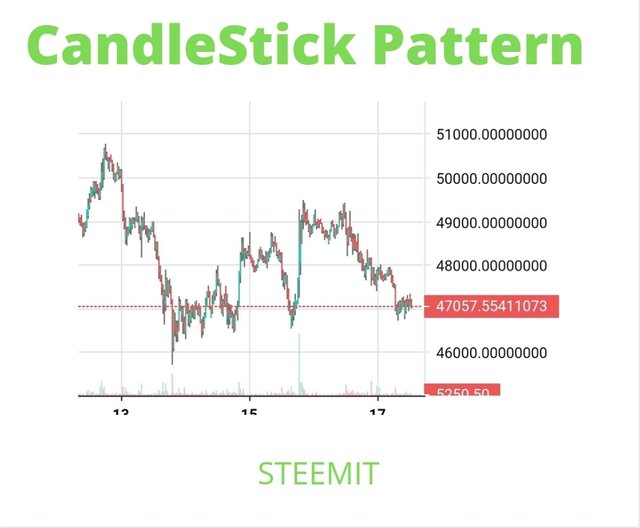
Image created by me @kenneth00 in canva
Currently there are various tools to analyze the financial market, Japanese candles are one of the most used by investors since they allow a better visualization of the price behavior of a product during a certain period of time, this type of graph is a tool, Simple to use and generates data that allows the investor to carry out a deep and individual technical analysis of a product, in turn Japanese candles allow the creation of strategies through patterns to establish a relationship, however this requires that the charts be studied and analyzed for a certain period of time this in order to avoid errors and achieve the best possible benefit.
Japanese candles offer a better picture of the price behavior of a product for a certain time, which allows a better interpretation so that the investor can predict what is going to happen, in turn provide useful information on the sentiments involved in the price. market such as greed, fear, greed, this is why traders prefer to analyze the Japanese candlestick charts as they provide much more useful information which will allow them to make wise decisions.
In summary, Japanese candles are a magnificent tool that can be used in different types of markets such as Forex, Stock Exchange, Commodities or Cryptocurrencies, this thanks to the fact that the information it provides on the values and trends will allow a more technical analysis to be carried out. precise which will lead to better decision making.
3) Describe a bullish and bearish candle. Also, explain their anatomy.
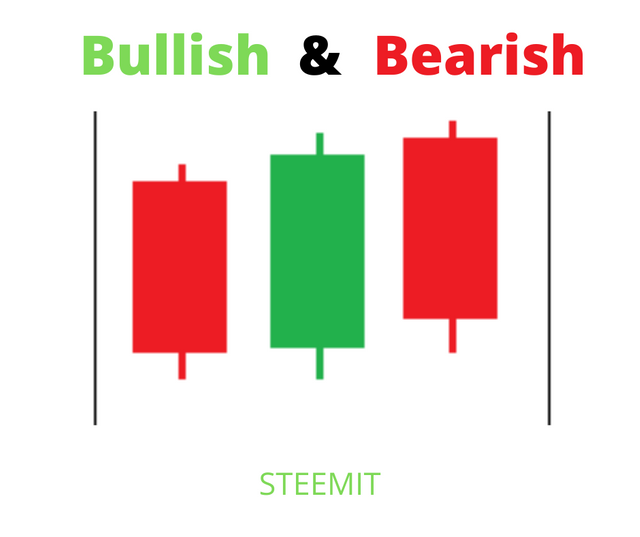
Image created by me @kenneth00 in canva
In order to analyze the Japanese candlestick chart, it is necessary to know their anatomy in this way we can understand the information they provide us.
.png)
Image created by me @kenneth00 in canva
Opening: Indicates the initial price where the candle is formed, it represents a period of time.
low: It is the lowest price reached by the asset in that period of time.
body: Indicates the price of the asset in the period of time represented by the candle.
Closing: Indicates the closing price of the time period.
High: It is the higest price reached by the asset in the time period of the candle.
Shadow: Indicates the path between the minimum price level or the maximum price level and the close or open of the candle.
In addition to knowing the anatomy of the candles, it is necessary to know their structure or formation in order to classify them:
- Bullish candle: This pattern is formed when the candle closes above the opening price, they occur when prices fall indicating that it is about to change, bullish candles are formed in a downtrend which indicates that sellers have lowered prices and that buyers are in control. They are usually represented by the color green or white.
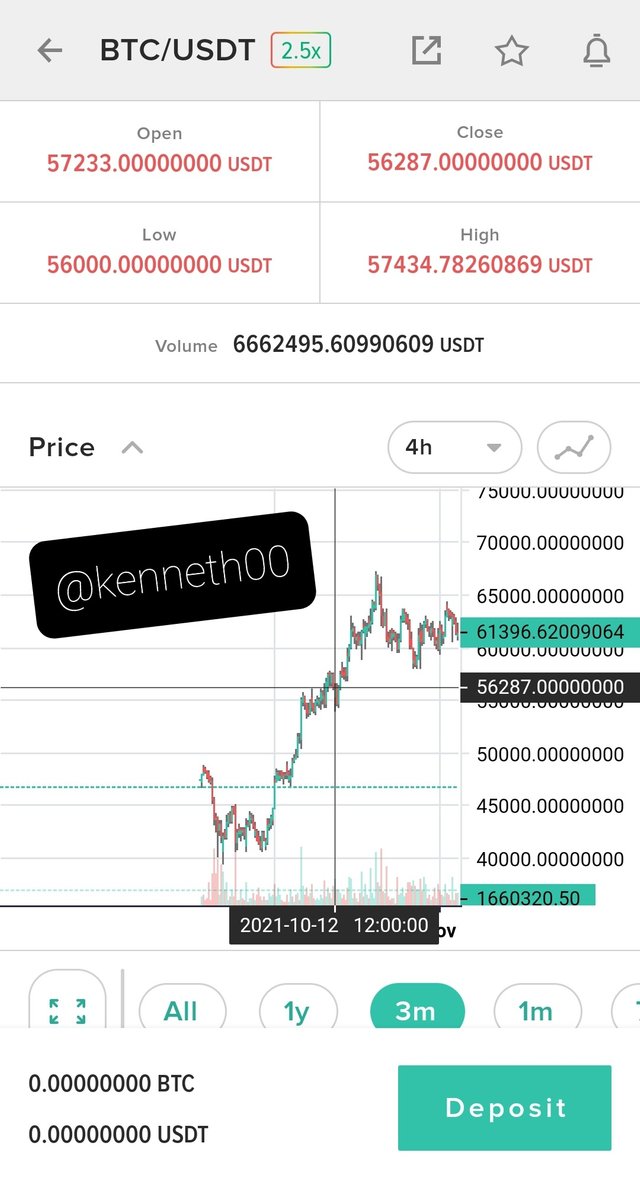
Bullish pattern
- Bearish Candle: This pattern is formed when the candle closes below the opening price, they are formed during upward trends indicating that a change will be generated, it shows us that sellers control the price. They are usually represented by the color red or black.
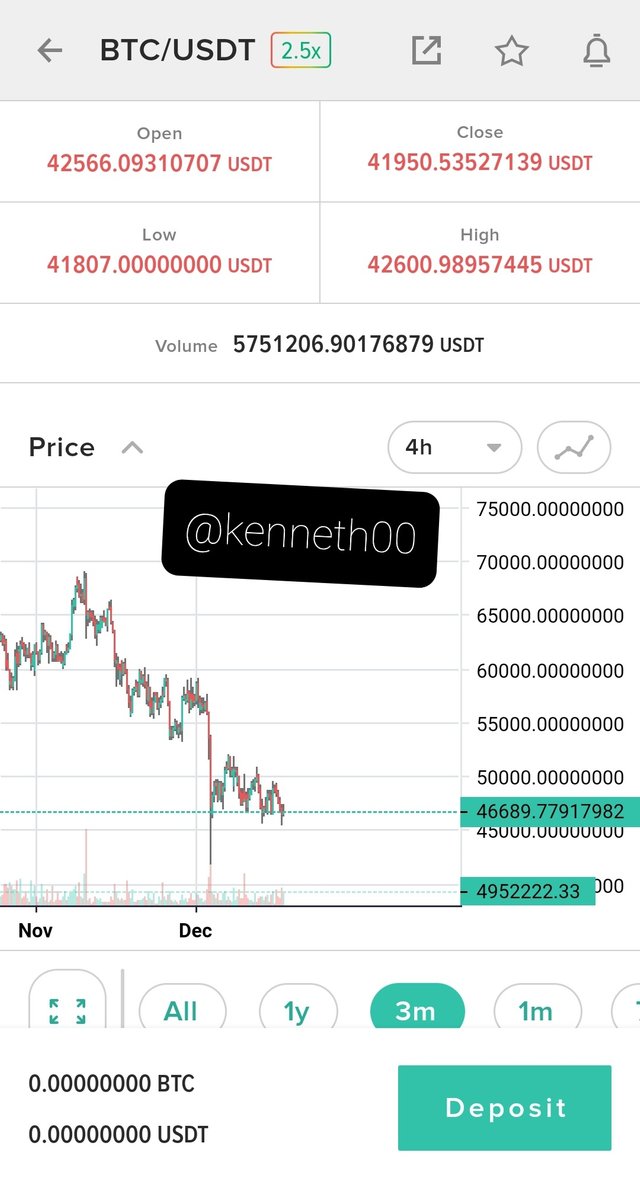
Bearish Pattern
Conclusion
Candle stick patterns are a very important piece when it comes to telling price of a particular asset because with it as a trader you can know when to sell or buy that asset.