Steemit Crypto Academy - Season 2, Week 6} Elliott Wave Theory -Delivered by Prof @fendit // Task done by @kelvincole
Good Day Everyone, good to be back on this platform. Another great lecture delivered by Prof @fendit. i Really enjoyed every bit of the lecture as it was well simplified and articulated. Without wasting more time, kindly see the answers to the Home task below
Question1: What's the application of this theory?
The Elliot Wave Theory created by Ralph Nelson Elliot, was based on the principle that the stock market moves in a particular pattern, and this patterns when carefully analyzed, makes it possible to predict price and make wise trading decisions.
The EWT, enabled Financial traders or investors to use technical analysis to carefully analyze the financial market cycles or processes and predict market trajectory/trend by establishing extremes in investors psychology that brings highs and lows in prices.
This Theory enables Traders/investors to carefully identify recurrent long term price patterns that results from persistent changes in investors sentiment and psychology. In other words, it meticulously ascertain market cycle/trend based on the ideas, disposition, thinking,behavior as well as mood swings in the investors towards the market and how it affects the change in prices or brings about price variation.Here, the investor recognize the fact that the market moves in a certain natural pattern and this unusual pattern helps us to forecast the price of any asset irrespective of whether it is in a bullish or bearish market trend.
This Theory also tend to show how stock price movement can be predicted base on their repeated up and down pattern identified as waves, which is based on investors psychology or sentiment, at a particular point in time. and also helps the trader to make informed decision on when to enter and exit the market at the appropriate time.
Conclusively, The EWT is used as a tool by Financial analyst and traders to predict investors sentiment that affects changes in price, so that the trader can have an edge in the Crypto Market, and by identifying the two major waves that operates in the market,whether bullish or bearish market trend, investors are in good position to determine their entry and exit position as well as when to set or activate a Stop Loss .
Question2: What are impulse and corrective waves? How can you easily spot the different waves?
The Elliot Wave Theory, identified two types of waves that can be analyzed based on their movement in reaction to the prevailing market trend, and the two waves are IMPULSIVE and CORRECTIVE wave. These waves as earlier stated, can operate in a bullish and bearish market trend and the wave patterns can be sum into 5-3, with the impulsive wave being the first five and the corrective wave the last three.
1) IMPULSIVE WAVE: The Impulsive wave as identified in the EWT, is one of the waves that makes up the market cycle. This wave goes with the market trend or the same direction with market forces, and represents the first 5 movement in the market trend. The wave can be identified both in the bullish and the bearish market trend. In other words, when the market seems to be bullish, the wave moves in the same bullish trend and vice versa when the market seems to be bearish.
The Impulsive wave also tends to show the different price variations in the market trend, and each wave identified in the market trend, signifies a particular behavior of people or disposition towards the market. The Impulsive waves are characterized with five waves in its formation in the market trend,and the waves are seen to be from wave 1-5. It is important to note that to be able to identify the various impulsive waves in the market trend, the wave 3 plays a very important role,as it has the longest wave trend. In addition, the Wave 2 & 4 follows the same directional wave pattern, while the wave 1 & 5 also follows the same directional wave pattern.
A better understanding of how to identify the various Impulsive wave patterns in the market trend is stated below:
- Wave 1: This wave identifies the beginning of the cycle, where the prices are relatively low,and as such, a small group of people or investors invest in the market as it begins its upward/bullish trend.
- Wave 2: Here, there is further drop in price as a result of some investors selling off for profit.Though the price will drop down a little, but will not be at the same price level with wave 1.
- Wave 3: This wave is seen as the longest wave in the impulsive wave pattern. This is so because, as a result of drop in price in wave 2, and the subsequent rush in demand for the asset, resulted to a quick rise in price.
- Wave 4: This wave in the market trend, shows a little drop in price as witnessed in wave 2. This is so, because as a result of the long trend seen in Wave 3, which led to investors making exit positions just to make profit, the market experiences a bearish trend.
- Wave 5: This Wave signifies the peak in the market trend.Here, there is slight increase in price as a result of entry positions by some traders who took advantage of the bullish market trend to buy at high prices, expecting the price to go further high, but unfortunately, the price trend are most likely to reverse and correct itself after this wave.
To sum up, in respect to the impulsive market trend, a prospective investor perfect entry position, is during the Wave 2, when the traders are optimistic of the market trend, and the best exit position is during the peak of the long trend in Wave 3.This is so because, as a soon as the trend begins to reverse and correct itself, the bearish market trend will definitely become inevitable.
2) CORRECTIVE WAVE: This Wave comes as the last three (3) Waves in the market trend after the impulsive wave.They are seen as corrective wave basically because they go contrary to the market trend. In other words, The Wave, unlike the impulsive Wave, goes completely in opposite direction to the market trend irrespective of whether it is a bullish or bearish market trend. In the Corrective Wave, the market reverses itself from the natural or usual pattern.
The Corrective Wave Pattern according to EWT, is usually seen as pauses within the prevailing market trend, as basically tend to retrace a part of the prior impulse move, which can be seen to be a drastic retracement against the impulsive wave in the market trend. This wave pattern is identified as A, B & C Corrective Wave Patterns. Why the Corrective wave A & C usually follows the same direction in the market trend, The Wave B always go in the opposite direction.
Elliot Wave Theory, identified three major types of patterns, which are:
- Zig Zag Corrective Wave Pattern
- Flat Corrective Wave Pattern
- Triangle Corrective Wave Pattern.
Zig Zag Wave Pattern: This is one of the more prevalent pattern seen in the market as it is usually seen as a sharp retracement against the market trend. It identifies the Pattern B as always different and moving in opposite direction from the wave A & C pattern.
Flat: This pattern is also a unique feature in the corrective wave pattern. This is a position in the market trend, where all points are equal unlike in the Zig Zag pattern, and the formation of Flat in a bearish corrective market will result to price moving higher after the completion of the pattern,and similarly, its formation in the Bullish corrective market will result to price dropping lower after the completion of the pattern.
Triangle Wave Pattern: In this wave pattern, though difficult to stop, the volatility and volume in the market trend is decreasing.
Question3: What are your thought on this theory? Why?
This theory was able to create awareness on the investors, on how collective human psychology or sentiment of the masses affects the market trend positively or negatively as well as how the disposition or reactions of crowd of investors to external forces,may propel them to investing in a certain way.
The EWT was able to highlight and identify repetitive patterns in the market trend in the form of waves that was brought about by the collective reaction or sentiment of the investors at a particular point in time.
Another important highlight of the EWT in Cryptocurrency world,is that it enabled the investor to identify the exact point of an impending reversal, so that they don't get carried away.
With this theory, most investors can correctly identify the repeated patterns in price from the current market trend, and as such, be able to be in a better position to predict subsequent movement in price. The traders are well informed to take better decision on when to enter or exit the market.
The EWT presented a platform for investors to actually ascertain how price variations in the market is subjected to forces or factors they ordinarily may not pay much attention to ab initio, like the collective sentiment of the masses or their collective human psychology.
Finally, a major draw back with this theory in respect to Cryptocurrency exchange , is that it is sometimes very difficult identifying the beginning or end of a wave in the market trend, especially in the impulsive 5-Wave cycle.
Question4: Choose a coinchart in which you were able to spot all impulse and correct waves and explain in detail what you see. Screenshots are required and make sure you name which cryptocurrency you're analyzing.
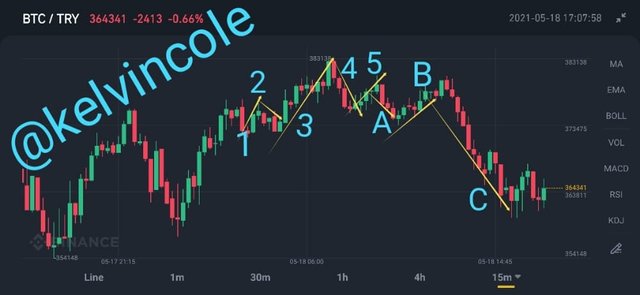
From the chart above, we are using the BTC/TRX pair market for the purpose of the Elliot Wave Theory Analysis. The market trend was traced when the price was just about the 373,475 mark, and thereafter, some trader were seen making entry positions into the market that resulted to an upward/Bullish trend. The bearish trend in the Wave 2, was as a result of some price difference experienced, that made the traders to make some exit positions with accrued profit. Thereafter, due to the drop of price in Wave 2, many investors took advantage of the opportunity, and immediately made an entry position, more significant than that made in Wave 1, this demand rush, due to the drop in price, resulted to the huge price rush and long trend identified in Wave 3. The desire by some investors to make profit, seeing how profitable the market is, resulted to them making some exit positions and as a result of such action, there is downward/bearish trend as seen in Wave 4. The exit position made by some traders due to the drop in price in Wave 4,will naturally propel traders to make entry positions,especially those who are determined to take advantage of the bullish trend, irrespective of the rise in price, and, as such, there is an upward trend as seen in Wave 5. The downward trend seen in the corrective Wave A, shows the market now reversing itself from the bullish trend. The Wave B, though still a correctional wave is seen moving at the upward direction, due to the slight rise in price, before finally dropping to a bearish trend as seen in Wave C.
From the Chart, there are some important take-ways/points to note:
A) Wave1 which signifies the beginning of the cycle, sees small entry positions by investors who invest in the asset, as the price is low.
B) Due to the exit positions made by some traders whose intention was to make profit in Wave 1, there appears a drop in price as seen in Wave 2, and this drop in price, subsequently attracted more traders to make a stronger entry position thereafter.
C) The Wave 3, signifies the longest wave, and this is so because of the massive entry in Wave 2 due to drop in price as investors take advantage of the bullish market trend.
D) The Wave 4 experienced a drop in price, basically as a result of exit positions made by some investors in the long Wave 3
E) The peak of the market trend which is Wave 5, sees a slight increase in price, and immediately after the bullish trend, the market reverses itself and follows the line of the corrective wave as seen in Wave A,B and C , appearing after the impulse Wave 5.
Thank You.
Special thanks again to Prof @fendit for this awesome lecture. As usual, am looking forward to the next Lecture.
Thank you for being part of my lecture and completing the task!
My comments:
Nice approach on this lecture!!
I really like how you really understood the concepts and came up with such good work :)
As a suggestion for next time, make sure to structure your post a bit different, so it's a bit more easy for the reader to catch up with it. Also, applying markdowns is a great idea to polish a lot more your work :)
Overall score:
8/10
Many thanks for the review Prof @fendit. your suggestion is well noted. Do have a great day. Cheers