[REPOST] STEEMIT CRYPTO ACADEMY - SEASON 2, WEEK 8// THE WYCKOFF METHOD BY PROF @fendit // Home task done by @kelvincole
Good Morning, Good to be back again on this amazing and educating platform to attend to the Home task given by Prof @fendit on Wyckoff Method in understanding Cryptocurrency. This lecture like her previous ones, was well simplified and impactful, as it exposed me to new ways and method to appreciating the Cryptocurrency world. Kindly see the Answers to the home task below.
Question1. Share your understanding on "Composite Man" and the fundamental laws. What's your point of view on them?
The WYCKOFF METHOD, just like the EWT is another tool used by technical analyst to predict the price of a Crypto asset in the cryptocurrency world. This Method recognizes the fact that by meticulously analyzing data related to volumes, price action and time, as a result of proper understanding of the demand and supply of a particular Crypto asset , will enable Financial analyst to comfortably predict or anticipate the price of the asset.This method significantly helped to create a perfect timing for investors thinking of making an entering position in the market. In other words, this method enables the investor/trader to have an idea of the exact time to invest on a Crypto asset . The Wyckoff Method laid emphasis on several theories and trading techniques, which are:
- Three Fundamental laws
- The Composite Man Concept
- Wyckoff schematics for analyzing charts
- A five step approach to the Market.
THE COMPOSITE MAN:
Wycloff basically centered his approach on his study of the market activities of some group of highly experienced or perceived better informed traders, who he regarded as the "Super traders" or Composite Operators. He went further to say that these Composite Operators, are in a better position to analyze the market, by observing the market trend in respect to Why, how, and what brings about price variations, and as such, are able to make maximum profit, due to their their potential in determining price trends and movement. The Wycloff Method was able to expose and unravel the ideas, purpose or driving force of these Composite Operators towards the stock market, and concluded that such behavior observed based on the volume and price movement was basically the guide to predicting or forecasting market direction in the future.
The Composite Man according to this method, is seen as an imaginary representation or identity of the market, that helps to appreciate how different movements affects or impacts price fluctuation. It see the market as been controlled by a single entity, rather than a group of well to do investors or institutions, i.e, the market should be study as being controlled by a single entity , as only through this way, it will be easy to determine the market trend.
The WYcloff Method created an avenue for the Financial/technical analyst to recognize and appreciate the importance and value of the Composite Man, and how its activities affects changes in price. The Composite Man will always endeavor to get the rest of the other investors to buy or purchase the same asset that he bought or has been accumulating during when the price was low . In other words, the Composite Man takes advantage of the early stage of the market trend, when prices are low, and demand high, to accumulate enough asset, and later when there is scarcity of that asset due to the excessive demand, he starts selling some of his asset to those investors who probably made late entry position into the market. The Composite Operators are the key players, such as the extremely rich traders or institutional investors, who act on their personal interest, by ensuring that they buy or make an entry position when prices are low and demand is high, accumulate enough asset, and sell some of their profit position ,when prices becomes high.
This Method helps us to appreciate and understand the behavior or activities of the Composite Man, and how such knowledge can help us conveniently predict or forecast the prices and direction of an asset in the market cycle.In other words, the Method, allows us to carefully and meticulously analyze the market as well as charts, with the aim of comprehending the behavior of the composite man, and what motivates their actions. This Method, identified Four Phases in understanding the Composite Man in the Market Cycle. The Phases are :
- Accumulation Phase
- Markup/Uptrend Phase
- Distribution Phase
- Markdown/Downward Phase
(1) ACCUMULATION PHASE: At this phase, the price is low and relatively stable with a high demand, and as such, the Composite Man makes an early entry position and accumulates enough assets before other investors makes their entry into the market, and he does so gradually, to avoid bringing about a significant variation in price. The Phase is characterized by side ways Movement.
(2) MARKUP/UPTREND PHASE: As a result of the accumulation of asset by the Composite Man in Phase one ( the accumulation Phase), the assets becomes relatively scarce, leading to an increase in demand as more and new investors who are excited and encouraged by the upward trend make entry positions. However, as a result of these several entry positions by new investors, the demand becomes excessively higher than the supply, which result to increase in price. It is worthy of note, that at this phase, there may be multiple phase of accumulation of asset as the traders struggle to take advantage of the market.
(3) DISTRIBUTION PHASE: This Phase is characterized by a sideways movement, as the Composite Man begins to sell some of his profitable positions to investors making a late entry into the market, due to the excess demand created during the uptrend. Here, the Composite Man takes advantage of the gap created by the excessive demand over supply to slowly and steadily sell some of his assets, till the demand gap is completely bridged or absorbed by the supply.
(4) MARKDOWN/DOWNWARD PHASE: This Phase, is marked by a downward trend, as the market starts reverting downwards. Here, as a result of the excessive supply by the Composite Man to service the excess demand created in the uptrend, supply becomes much higher than demand, and as such, leads to a Markdown. The downward trend can also result to re-distribution phases, seen as a short term consolidation between huge price fall.
FUNDAMENTAL LAWS OF WYCKOFF
Wyckoff based his chart analysis on the knowledge of three fundamental laws. To him, the understanding of these laws will enable traders to tell the price direction or movement of an asset, as well as the best time to make an early entry into the market. His three Fundamental laws are:
- The Law Of Demand And Supply
- The Law Of Cause And Effect.
- The Law Of Effort VS Result.
(A) THE LAW OF SUPPLY AND DEMAND: In Economics, it is generally believed that the higher the demand for a product, the higher the price of that product, and the higher the supply of a product against the demand, the lower the price. The WYCKOFF METHOD also recognizes this principle. To Wyckoff, price movement or direction, whether uptrend or downtrend is determined by the interplay of demand and supply. He believes that when there is a limited supply of an asset, it increases the value of that asset, which leads to increase in its demand to create the supply need. Similarly, when there is excess or unlimited supply of that asset, the value of asset depreciates to attract the required demand needed to accommodate the supply.
The law clearly states that an asset with a greater demand, appreciates in value and as such increases in price. and the higher the supply of an asset over its demand, the less valuable that asset becomes and there will be significant drop in price of that asset. Here, the movement or direction of the price of an asset is a factor of the supply and demand of that particular asset. Therefore, carefully analyzing the demand and supply of an asset, will help to appropriately determine or forecast the future price trend of that asset in the market cycle. This law can be represented with a simple equation below:
- Demand > Supply = Price rise
- Demand< Supply = Price drop
- Demand = Supply = Little or no significant price change.
(B) THE LAW OF CAUSE AND EFFECT: Just like the law of price movement determined by demand and supply, the cause and effect law clearly states that nothing, in the market happens by chance or no justifiable reason. It states that there is always the cause and effect factor in price movement in the market cycle. To Wyckoff, the movement of price in the market is greatly determined by specific events or group of events, which result from a preparation period, and this period can either be the accumulation period or distribution period.
This law holds that for the price of an asset to change, there has to be a cause, and this change in price(effect) is directly proportional to its cause.It believes that the disparities between supply and demand are not random, but rather, results from periods of preparation. To Wyckoff, a phase of accumulation(cause) automatically results to an upward trend(effect), and in contrast, a phase of distribution(cause) ,automatically leads to a downward trend(effect). This law identified two key preparation periods that tend to result to a particular outcome(effect). They are:
(i) Accumulation Period: At this period, the demand is greater than supply, and as such, the investors/traders make more entry position or buy more asset , which eventually leads to a rise in price , usually seen as a markup in the market chart. In other words, the eventual rise in price(effect) is as a result of a higher demand experienced in the accumulation period or phase.
(ii) Distribution Period: Here, the supply is greater than the demand, and as a result, there is a markdown or drop in price. similarly, the greater the supply or distribution(cause), the eventual drop in price in the future(effect).
(C) THE LAW OF EFFORT VS RESULT: This law tend to emphasize on the volume that an asset has, and if the volume has a connection with the price, then its certain that the trend is on course, but in a situation, where there is no connection between the volume and price, then the trend definitely will experience a change.
The Wyckoff law simply state here that any change or changes experienced in the price of an asset, is basically due to the effort or trading volume. Here, if the price action is in agreement or consonance with the volume, there is every tendency that the market trend will continue, However, if there is significant divergence or disharmony between the price and volume, the trend will most likely change direction or stop.
Question2. Share a chart of any cryptocurrency of your choice (BTC or ETH won't be taken into account for this work) and analyze it by applying this method. Show clearly the different phases, how the volume changes and give detail of what you're seeing.
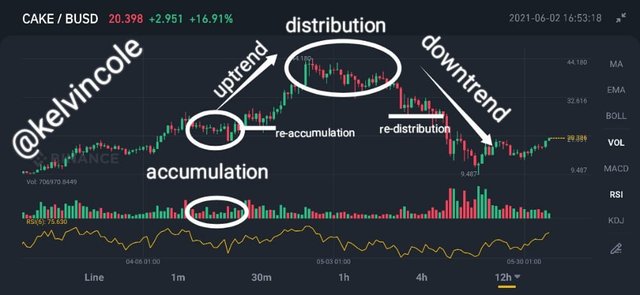
The chart above is a CAKE/BUSD pair, with a 12h time frame. From the Chart, all phases of the WYCHOFF cycle has been carefully marked out, starting from the accumulation cycle to the downtrend.
The ACCUMULATION PHASE as seen in the chart, clearly shows the beginning of the market trend, with a sideways movement, depicting that price is stable with low volatility. The Composite Man takes advantage of this phase to make an early entry position, in order to accumulate more asset before other investors starts making entry positions.
In the next phase, as seen in the chart, the prices starts to rise, resulting to an UPTREND. This is basically due to the accumulation of asset by the Composite Man in the First phase,bringing about scarcity of the asset, due to pressure in demand. Here, the Composite Man pushes the prices up as demand outweighs supply, with new investors making entry positions. Also, in the course of the uptrend, there is re- accumulation , as more investors gets excited about the demand of the asset and continue making entry positions. All this uptrend movement to the composite Man is like profit margins, as he re-accumulate and wait for the perfect time to sell his profit positions.
Taking a further look at the chart, the DISTRIBUTION PHASE as marked, clearly shows side ways movement as the price has reached its peak, even when there is slight increase in volume. Here, the Composite man slowly and gradually starts selling off some of his profitable positions to those making a late entry into the market, due scarcity of the asset, brought about by pressure in demand. The Composite Man takes advantage of those investors making late entry into the market to sell some of the asset he accumulated at the beginning of the market cycle.
Finally, the DOWNTREND as seen in the chart, shows a phase, where the supply now outweighs the demand, and as such, the asset depreciates in value as the price and volume starts dropping. The side ways movement experienced in the distribution phase as price reached its peak, and investors selling their asset to late entrance into the market, resulted to supply eventually growing higher than demand, which automatically resulted to the Downtrend as seen in the chart. Just like the re- accumulation in the Uptrend phase,there is also the appearance of re-distribution as the market trends downward, basically due to short -term consolidation between the significant price drops. At this phase, as more investors, apart from the Composite Man continue to make exit positions, the market significantly drops to a bearish trend.
Conclusively, the MYCKOFF METHOD created a platform for investors and technical analyst to fully comprehend /understand the underlying factors that brings about price movement, and how the influence/activities of the Composite Man can go a along way to dictating the future price of an asset.
Many thanks once again to Prof @fendit, for the opportunity to engage in this home task.
OLD LINK: https://steemit.com/hive-108451/@kelvincole/steemit-crypto-academy-season-2-week-8-the-wyckoff-method-by-prof-fendit-home-task-done-by-kelvincole