Crypto Academy / Season 3 / Week 8 - Homework Post for Professor @cryptokraze. Trading Sharkfin Pattern
I am glad we finally made it to week 8 the last week for this season, it has been an amazing journey. I am @kelechisamuel and this is my homework post for @cryptokraze , I will try to be direct and straight to the point
1 - What is your understanding of Sharkfin Patterns. Give Examples (Clear Charts Needed)
Firstly, sharkfin pattern, i think was gotten from the shape of the shark fin in the high sea, the shark fin is usually produces a V shape or an inverted V shape. i feel it was gotten from the shark itself. Patterns are part and parcel of technical analysis, but you need to master it before you can use it for your live trade. Pattern is always in a price chart and it helps to determine what next the price can do, based on what it has done previously. They are contless number of chart pattern in the crypto world such the head & shoulder, Double top, Double bottom etc,. Patterns can be used to determine if a trend is going to continue, if it is going to reverse, where to put your stop loss, where also to put your take profit, you can also use it to determine the your support and resistance level, it can also be used to generate signal in crypto market. and so many other importance, that is why it importance can't be underestimated.
So, what is SharKfin Pattern trading strategy and does it work, how can it benefit us to be a profitable trader in the crypto market. Whenever you notice a very fast moving market and suddenly reverses fast as well with most time long candle . And if this pattern of reversal produces a V shaped pattern mostly at the down side of the market in a downtrend and also it can produce an Inverted V shaped pattern most at the top side of the market in an uptrend, the reversal pattern can be said to be Sharkfin pattern and to make it using this Sharkfin pattern it is very important to target and enter the trade once you have confirmed the Sharkfin Strategy early.
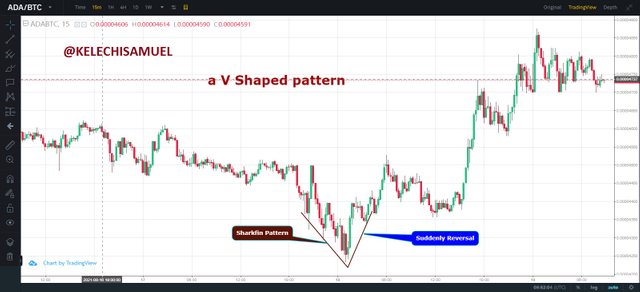
You can see from the pair of ADA/BTC in 15mins time frame, how the sharkfin pattern was formed, we got our V shaped pattern at the lowest low of the crypto market, which is an good indication for a buy and a very long buy for that matter. You can also see the very fast movement of price and the candle and a very fast reversal, these are some criterias
You can see from the pair of ADA/BTC in 15mins time frame, how the sharkfin pattern was formed, we got our inverted V shaped pattern at the highest high of the crypto market, which is an good indication for a Sell and a very long Sell for that matter. you can also see the speed at which the price moved and see also the very quick reversal at the top, these are some good criterias in determining the sharkfin pattern.

2 - Implement RSI indicator to spot sharkfin patterns. (Clear Charts Needed)
Just only using the normal price action, it might be very difficult for one to rightfully determine the sharkfin pattern properly. For you wrrongly determine the sharkfin pattern it might cost you a huge sum of losses. So from series studies and analysis carried out, an indicator was discovered that can help traders spot the proper Sharkfin Pattern at the right time. The Indicator is the Relative Strength Index, was is fondly know as the RSI. Using RSI has helped and is still helping to spot the tright Sharkfin patterns for a Buy opportunity and also a sell opportunity. The settings of the RSI should be left as default setting, with a period of 14 and the overbought as 70 level and the oversold as 30 level, With just these simple settings we are good to go.
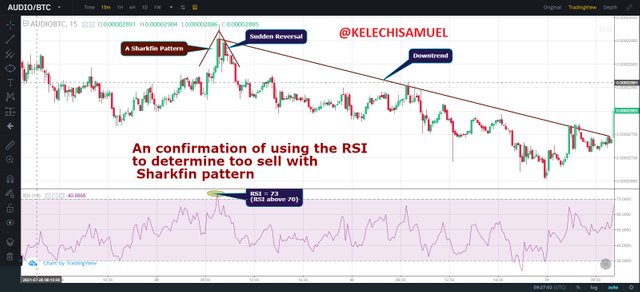
Using the RSI to spot the Sharkfin pattern, The RSI perid has to be set to 14 level, and the oversold and the overbought will be 30 and 70 respectively. it was used in the pair of AUDIO/BTC, in a 15 mins time frame, the RSI from the chart was at 73 level which is an overbought and it signifies a sell. looking at the price action, you have noticed the inverted V shaped already formed. Just wait bit after the formation and execute the sell order.
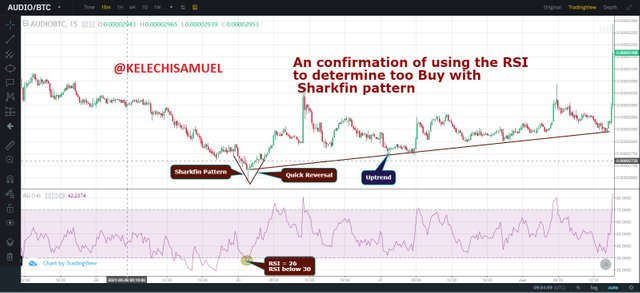
In the chart below of AUDIO/BTC in a 15 mins time frame, the RSI was below 30, it was at 26, which is a very opportunity but lets look at the price action in the chart before we can confirm anything, from the chart we can a very quick reversal at the lowest low of the trade, and also it has formed a V shaped which indicated a sharkfin pattern. it is a very good spot to enter a buy order and enjoy your profit.
3 - Write the trade entry and exit criteria to trade sharkfin pattern (Clear Charts Needed)
For a Trade Entry Sell order, the following criterias must be in place
- After open your trade using an platform of yours, in my case i'm using the tradingveiw
- Ensure to Add the RSI indicator and all the settings should be at default state.
- For you to execute a buy order, The RSI must go Above the 70 level
- There must be a quick price movement and a sharp reversal at a high point in the chart
- Make sure that the Inverted V shaped is formed, this will indicate the Sharkfin patterns.
- All the conditions properly placed, you can place your buy order.
- You can also put your take profit and stop loss.
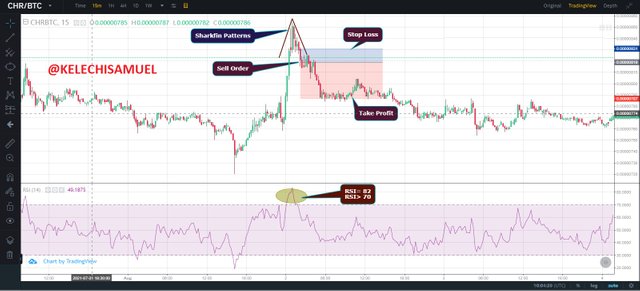
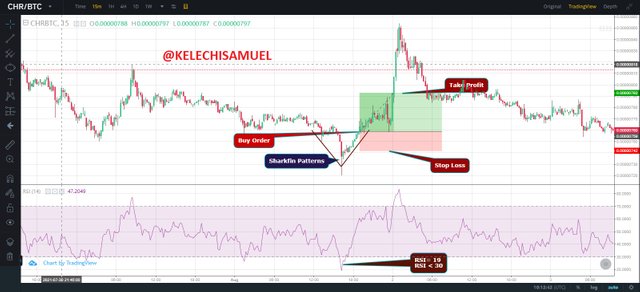
This is a pair of CHR/BTC, in a 15 mins time frame, you can see that firstly, that the RSI is above the 70, which shows that it is good sign for a sell using only RSI, but you can see too, that an Inverted V shaped was formed at the high point of the trade, which is an indication of a confirmation of a sell order. After the Pattern is formed, you can enter your sell order. Don't for get to also add your take profit and yor stop loss.
For a Trade Entry Buy order, the following criterias must be in place
- After open your trade using an platform of yours, in my case i'm using the tradingveiw
- Ensure to Add the RSI indicator and all the settings should be at default state.
- For you to execute a buy order, The RSI must go below 30 level
- There must be a quick price movement and a sharp reversal in a low point in the market
- Make sure that the V shaped is formed, this will indicate the Sharkfin patterns.
- All the conditions properly placed, you can place your buy order.
- You can also put your take profit and stop loss.
In the chart below, in a pair Of CHR/BTC in a 15 mins time frame, you can also see that the RSI is below the 30 level and it is a sign of an oversold, indicating that buy order. Couple with the formation V shaped pattern which is the Sharkfin pattern at the low point of the market. It is a clear indication that it is a clear sign to for a buy. enter your buy order, after the formation of the V shaped pattern, ensure to set your stop loss and take profit.
Criterias for the Exit position for Buy order
- Ensure to set your Stop loss
- You can use the recent lowest point as your stop loss
- Set your Take profit level too, if the price moves in your favour
- You should also use a 1:1 risk to reward ratio for a start
- Manually end the trade, if you find that your analysis was wrong
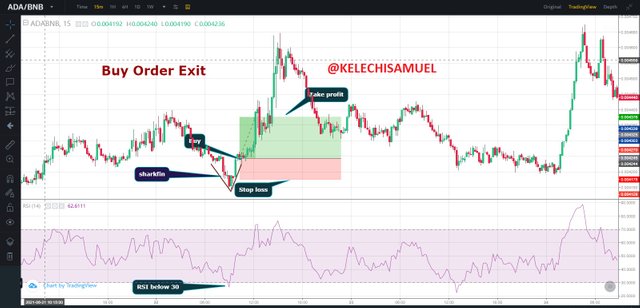
In the chart below of the pair ADA/BNB in 15mins, the RSI is below the 30 level and the V shaped pattern is formed which is indicate Sharkfin pattern. which shows the proper trade entry and the stop loss and the take profit helps us to determine the exit point. The stop loss is set in respect the previous lowest point and if you watch the price did not touch our stop loss and it touched our take profit immediately
Criterias for the Exit position for Sell order
- Ensure to set your Stop loss
- You can use the recent highest point as your stop loss
- Set your Take profit level too, if the price moves in your favour
- You should also use a 1:1 risk to reward ratio for a start
- Manually end the trade, if you find that your analysis was wrong
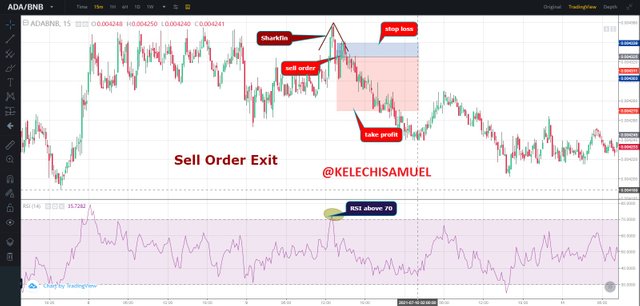
In the chart below of the pair ADA/BNB in 15mins, the RSI is above the 70 level and theinverted V shaped pattern is formed which is indicate Sharkfin pattern for a sell. which shows the proper trade entry point and the stop loss and the take profit helps us to determine the exit point. The stop loss is set in respect the previous highest point and if you watch the price did not touch our stop loss and it touched our take profit immediately
4 - Place at least 2 trades based on sharkfin pattern strategy (Need to actually place trades in demo account along with Clear Charts)
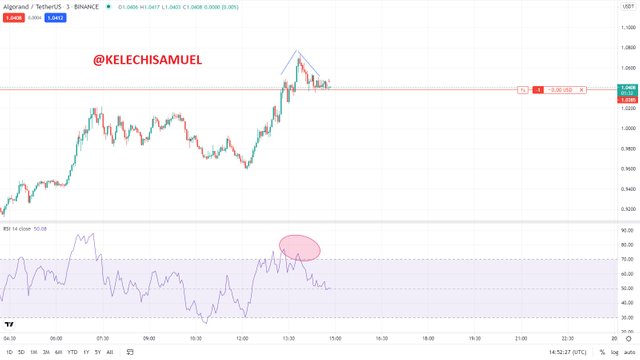
The Chart below is a pair of Algorand /TetherUs in a 3mins timeframe, From the Chart you can see that the Sharkfin pattern with the Inverted V shaped at the top of the chart and the RSI is already above the 70 level. this is a very good point for a sell opportunity, so i bought
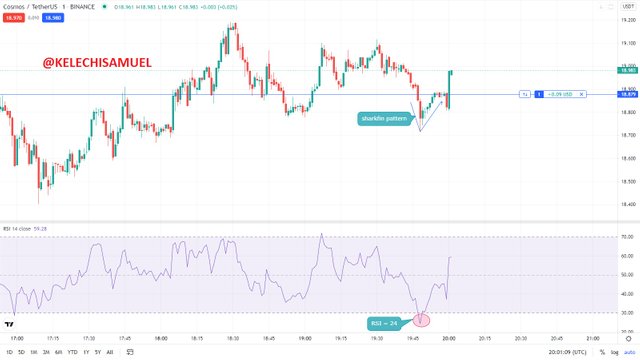
In the second chart below, Cosmos/TetherUs in a 1 hour time frame, The sharkfin pattern is formed with the V shaped at the low side of the market and you can also see that the RSI is below 30. From the analysis, this is a good indication for a buy with a lot size of 0.01.
CONCLUSION
In conclusion, Sharkfin Pattern works well with help of RSI to helps us to get a good reversal at a very early stage, using it properly with all the required criteria persent, you can earn a lot from the market.
The strategy was a new one and I am glad I understood it making analysis as regards the question and placing trades on the demo account
best regards
@cryptokraze