Crypto Academy Season 03 - Week 06 | Advanced Course - Trading Liquidity Levels The Right Way
What is your understanding of the Liquidity Level. Give Examples (Clear Charts Needed)
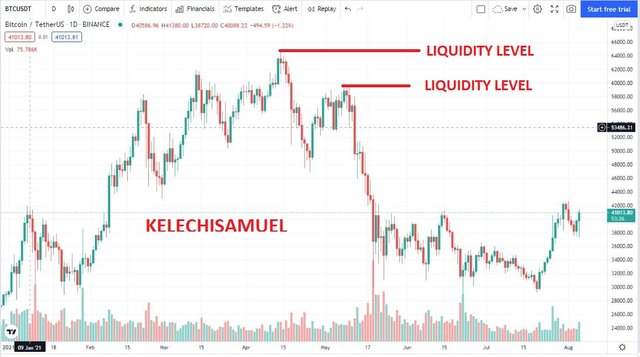
first of all what is liquidity, liquidity is the act of converting asset into cash or another asset with ease. so at this point, buy orders are filled quickly because of the activeness of the market.
to that effect, there are levels that has been set by traders in which they expect to withdraw or liquidate. this levels are called liquidity levels
Explain the reasons why traders got trapped in Fakeouts. Provide at least 2 charts showing clear fakeout.
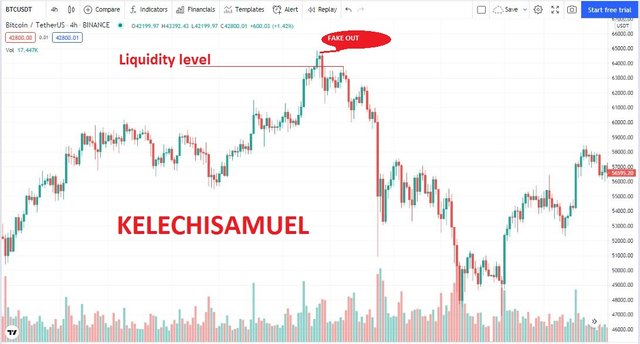
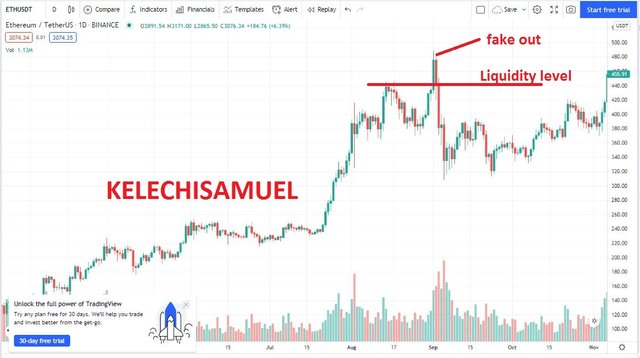
firstly, fakeout is an instance in which the trader puts a trade in anticipation of a continuous growth in that direction but instead, it goes the opposite direction
there are a few reasons why traders get trapped in a fakeout
PATTERN REPETITION
Most traders work with a certain repetition pattern on the chart and they work with history and patterns. so if peradventure they see a resemblance in the current chart they are watching, they tend to assume that same might occur and they eventually get trapped in the fakeoutGREED
Many traders are naturally greedy and always wants to make irrational profits so even while they know that possibly this may be a fakeout, they intentional want to try their luck rather than pull outFINANCIAL INSTITUTION
this is on of the core reason for fakeouts, when financial institutions discover that some important liquidity levels will soon be reached, they tend to manipulate the volumes and change the price rates making traders place their trades above or below depending on their stop loss
How you can trade the Liquidity Levels the right way? Write the trade criteria for Liquidity Levels Trading (Clear Charts Needed)
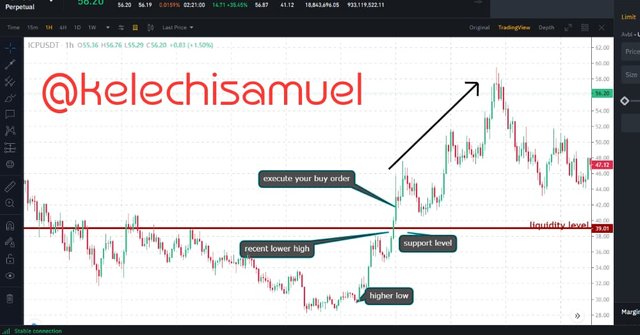
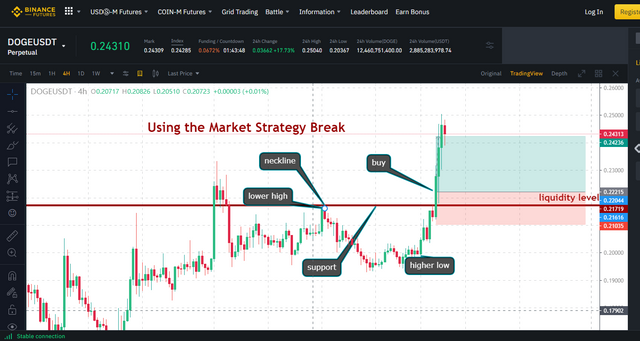
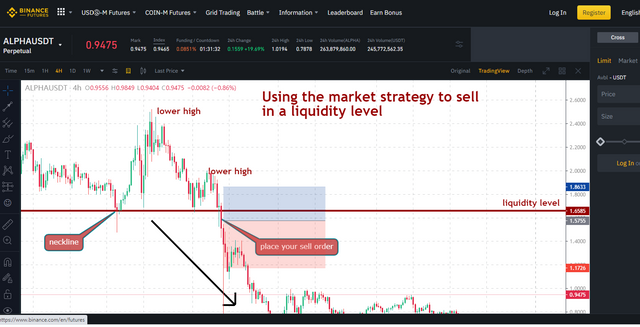
Basically, there are 2 ways of trading the liquidity level which are the market strategy break and the break retest break. Let's look at the both of them. The MSB, the is used whenever a trend wants to reverse, if caught properly, you will be swimming in profit. This can achieved when the current price has passed the recent lower high of the trend which can be called a neckline. These are the steps for the trade with MSB properly. Let's say you want to
buy order
- The price should be at the support level in any time frame of yours..
- Wait for the price to move above the recent price swing which is lower high
- Ensure to draw the support level properly
- Mark out your neckline with a straight line.
- You place your buy order
For sell order
The following has to be done..
- the price must have reach to a major resistance at the top of the trade..
- Make the price forms a higher low that should be below the most recent higher lows
- Mark out your neckline carefully
- You can now place your sell order
- Ensure to put your risk to reward ratio.
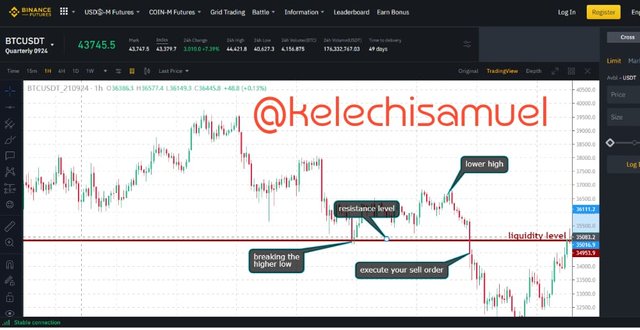
BREAK RETEST BREAK STRATEGY
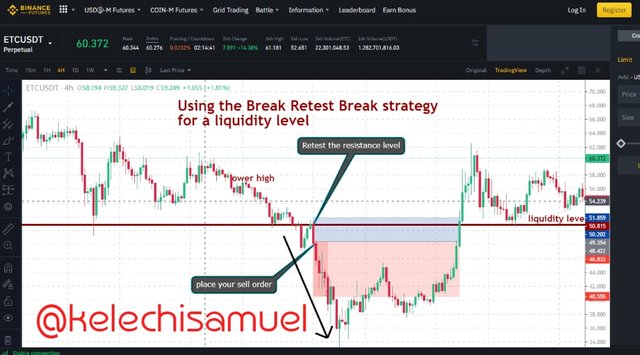
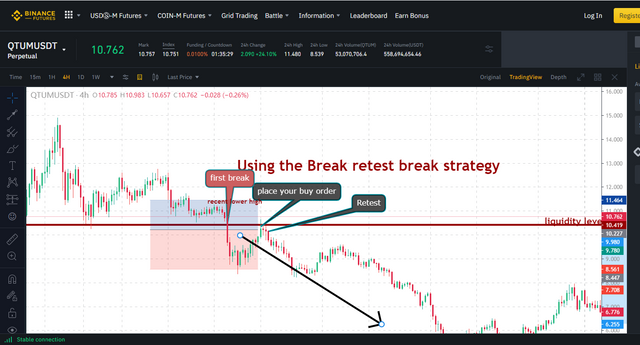
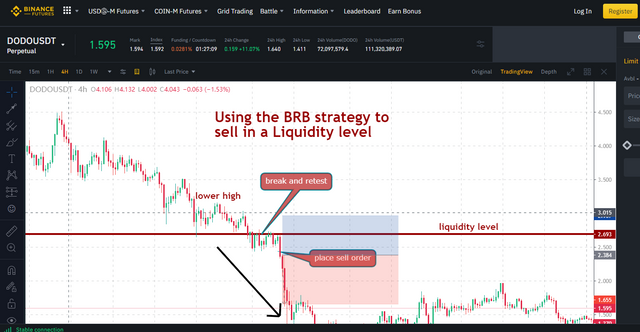
Using the Break retest break strategy, is the 2nd for liquidity levels. this strategy is used for the continuation of the trend, but the price first breaks through the support or resistance , then come back for retest before finally breaking it again and moving forward. it is very importantt for trend continuation considering the previous the lower high or higher lows depending on the trade you want to execute.
for a sell using the BRB
- allow the price to move towards the resistance not so up because the strategy is for continuation
- wait for the price to break the resistance
- allow the price to retest the the resistance level
- then you can enter the sell order
- ensure to put your take profit and stop loss
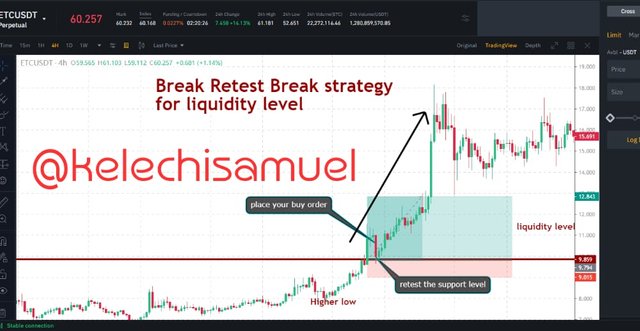
for a buy using the BRB
- allow the price to move towards the support not so down because the strategy is for continuation
- wait for the price to break the support
- allow the price to retest the the support level
- then you can enter the buy order
- ensure to put your take profit and stop loss
Draw Liquidity levels trade setups on 4 Crypto Assets (Clear Charts Needed)
I will be showing graph of 4 liquidity levels trade setups on the 4 crypto assets below
Conclusion
I must really say the liquidity level is an important knowledge every trader should know add to the fact that if not learnt a trader could loss alot
Dear @kelechisamuel
Thank you for participating in Steemit Crypto Academy Season 03 and making efforts to complete the homework task. You got 6/10 Grade Points according to the following Scale;
Key Notes:
We appreciate your efforts in Crypto academy and look forward for your next homework tasks.
Regards
@cryptokraze