Steemit Crypto Academy | Season 4 Week 1 Homework Post for @allbert | Trading with Strong, Weak and Gap Levels
Hello everyone. Our world has been fighting a big epidemic for almost 2 years. I hope all of you are in good health. Stay healthy!
Today I will share with you the my homework given by the professor @allbert

1-)Graphically, explain the difference between Weak and Strong Levels. (Screenshots required) Explain what happens in the market for these differences to occur.
The cryptocurrency market has two sides. The price rises or falls. Sometimes it can be stable, but in general, we see prices rising or falling. This is based on the dominance of buyers or sellers in the market. If the price is bullish, the buyers dominate (bullish), otherwise the sellers come forward (bearish). Regardless of whether we are experienced or inexperienced in these situations, what we will do is to detect the previous movements of the price and predict the direction of the market. The most helpful thing in this regard is the support and resistance levels of the prices.
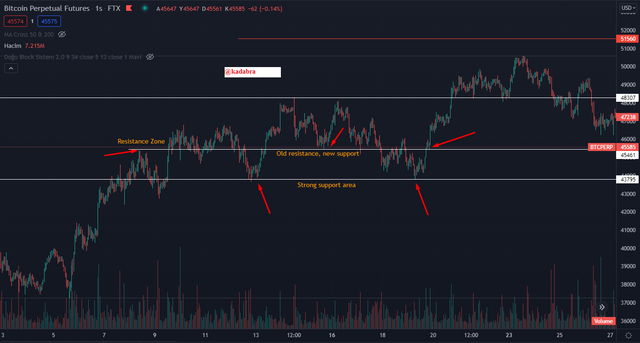
When we look at Bitcoin, we can see the support and resistance levels that caught our eye. Since the region that works as a resistance could not be broken, the price went down to the support region. However, since the support zone was not fully mature, the price rose again after falling to the region where it could find buyers. After the resistance zone was tested with fake breakouts, Bitcoin's 43,700 levels became support.
- Weak and Strong Levels
When we watch price movements, we see movements where old resistance areas act as support and old support areas as resistance. What is important here is the weakness and strength of the price at the location of buyers and sellers.
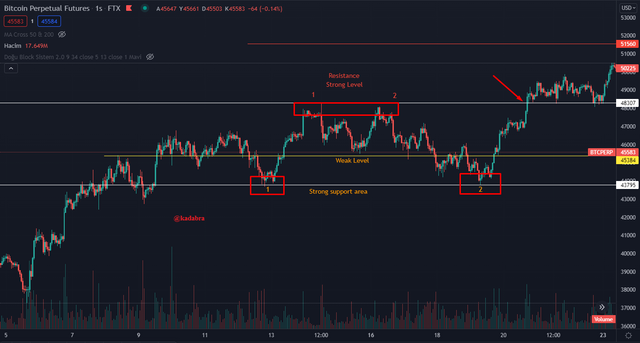
The main support, main resistance and intermediate support, intermediate resistance zones, known among traders, are the same strong and weak zones in our topic. If the price is getting an upside reaction from the region where it has reacted at least 2 times before, this is a strong region. So it is the main support zone. The same is true for the resistance zone. An area where the price fails to break a minimum of 2 times is a seller-dominated area and it is a strong area that acts as the main resistance. In the chart, I have shown the strong areas where Bitcoin has reacted twice. These regions are the regions where buyers and sellers are dominant. But between these regions, there is also a region described as a weak region. This region, which has intermediate support and resistance zones, is a place that should be approached cautiously, but can be considered as scalp.
The reaction from the strong support zone on the Bitcoin chart enabled the strong resistance zone to be broken after the resistance in the weak zone became support.
- Why do differences occur?
The formation of strong and weak zones in price movements depends entirely on the volume of buyers and sellers. The previously unbroken and strongly tested zone is a strong zone whether it is support or resistance. However, the region in which there are fake movements is generally called the weak region.

2-)Explain what a Gap is. (Required Screenshots) What happens in the market to cause It.
Gap in money markets are gaps that occur when no transactions are made. These gaps, which occur due to many reasons, can occur in the direction of rise and fall. This two-way price change can even cause the price trend to change.
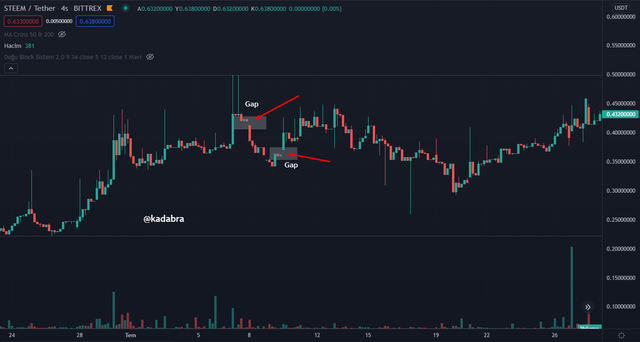
These gaps in price movements can put buyers or sellers in a difficult position as they can move towards the opposite direction of the price trend. Therefore, care should be taken when these gaps occur.
3-)Explain the types of Gap (Screenshots required, it is not allowed to use the same images of the class).
Breakaway Gap
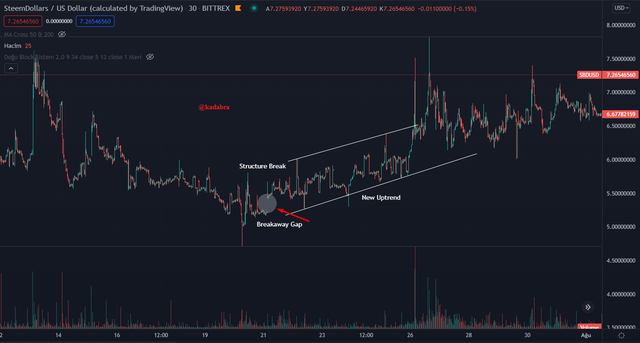
This type of gap usually indicates that the price will move against the established trend. When this gap occurs, the price indicates that it is preparing for a new trend and gives a tip to the traders in the direction of trading. The process can be entered by following the structure break. Breakaway Gaps is the most important indicator to have a preliminary idea about the market.
Runaway Gap
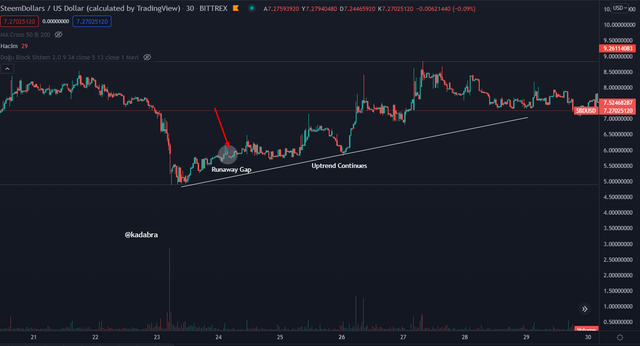
These gaps usually occur in the middle of the trend and give traders a clue about the continuation of the trend. If it occurs in the middle of an uptrend, traders anticipate that the trend will continue and trade in the buyer's direction. In the other situation, the sellers are more dominant and the decline is confirmed in the runaway gap formation.
Exhaustion Gap
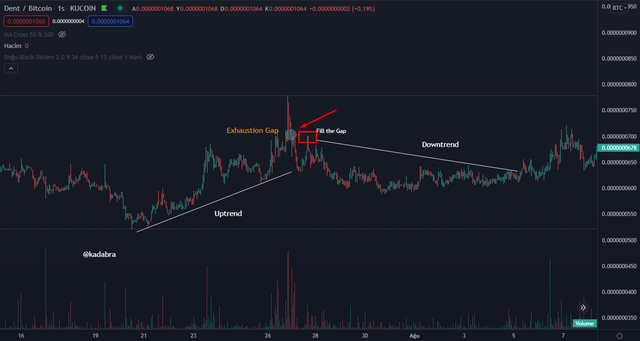
Known for its similarity to the Runaway Gap, this gap is known to appear at the end of the trend and gives traders a clue that an uptrend or downtrend is over. It indicates that the price has reached the saturation point and when this gap is formed, the price tries to fill this gap one last time and then starts a reverse trend. As we can see in the chart, the Exhaustion gap formed during the uptrend was filled by the price after a while, and then the price movement started in the downtrend.
4-)Through a Demo account, perform the (buy/sell) through Strong Supports and resistances. Explain the procedure (Required Screenshots).
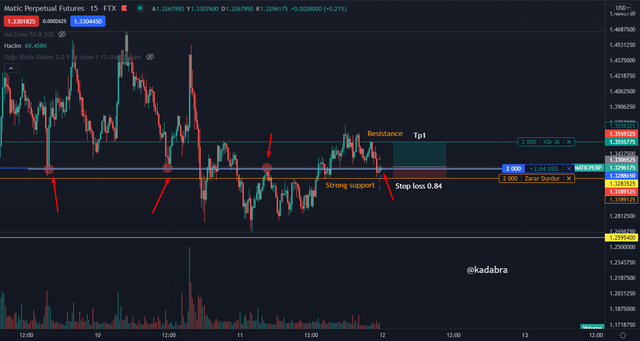
Trade 1: Buy Order
Matic - USD - I opened a long position on the 15-minute chart. I expect an upside reaction from here as the price is at the place that has worked as support and resistance twice before.
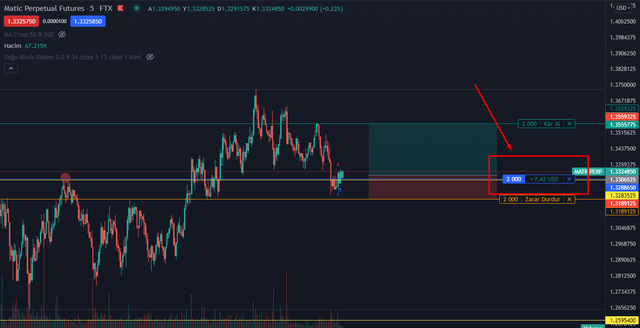
I closed my matic buy position with profit.
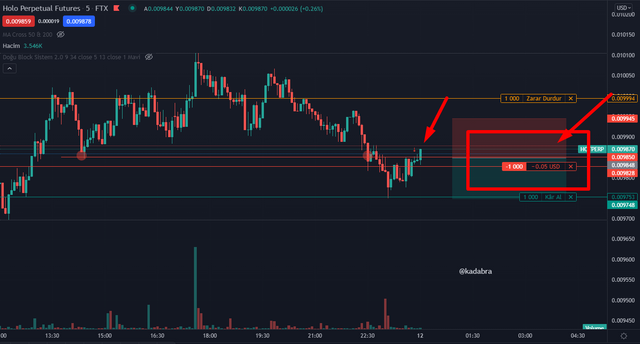
Trade 2: Sell Order
This time, I open a short trade in Hot - USD parity. The retest of the previously broken support has taken place and I preferred to trade on the downside.
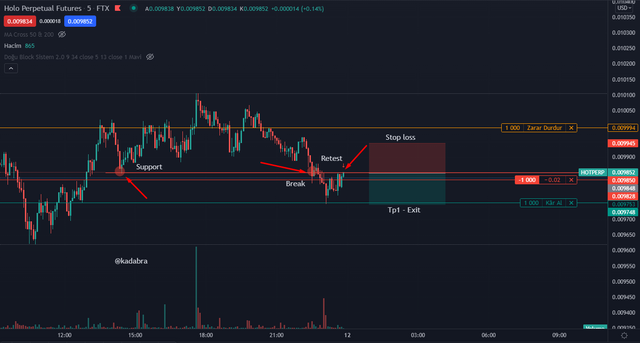
I closed my Hot - USD short exposure with a loss.
5-)Through a Demo account, perform the (buy/sell) through Gaps levels. Explain the procedure (Required Screenshots).
Because of the confirmation of the rising trend with Runaway Gap, I think that a long transaction can be opened in CHZ - Bitcoin chart. I have determined the stop loss and Take Profit zones.
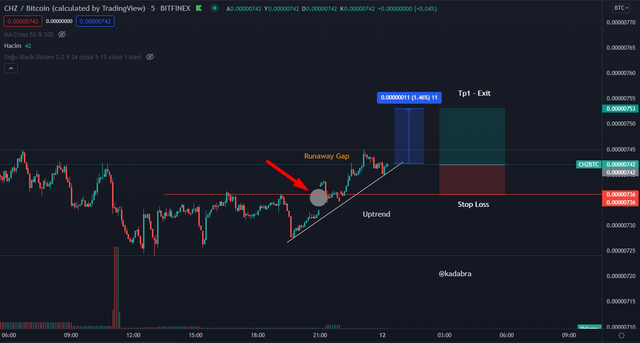
I closed the position with 0.45% profit.
Conclusion
In this assignment, I both explained the importance of support and resistance lines and reinforced myself. The first rule to simply trade is to apply support and resistances correctly. However, these supports and resistances, as mentioned in the lesson, diverge in themselves and it is necessary to learn them well.
I also tried to explain the causes and types of gaps in the money market. It is possible to open more profitable transactions by learning these gaps. In addition, I opened trades using these gaps, which are considered to be the clues of the trend direction, and I indicated my profits and losses under the charts.
Two of the three trades I opened were closed with a profit, and one with a small loss.
For this course, I thank to the Prof. @allbert. I will continue to learn and practice.
CC:
@allbert