[Heikin-Ashi Trading Strategy]-Steemit Crypto Academy | S4W2 | Homework Post for @reddileep
Hello everyone. Our world has been fighting a big epidemic for almost 2 years. I hope all of you are in good health. Stay healthy!
Today I will share with you the my homework given by the professor @reddileep

1-)Define Heikin-Ashi Technique in your own words.
Candlestick charts used in chart analysis of an asset help the trader to create their buying and selling plans. These candles can give investors many clues about the momentum of an asset. However, investors should not buy and sell assets completely depending on this. We should support these analyzes using many basic studies and indicators.
Heikin-Ashi is a Japanese term and means average pace, it is a candle that we use in chart analysis. Heikin-Ashi was developed by Munehisa Homma in the 18th century and is used in chart analysis.
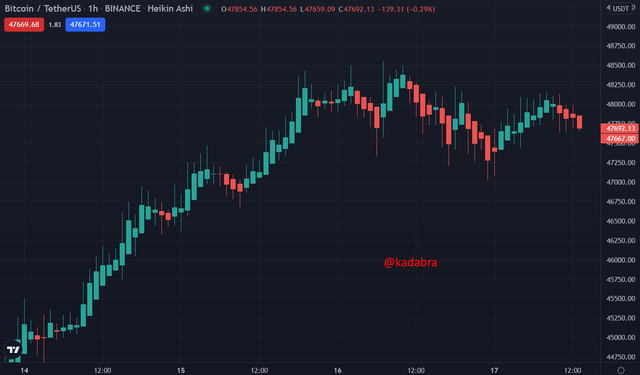
Heikin-Ashi is similar to other candlestick charts, but different values are used when creating candles. In the Heikin-Ashi technique, the opening, high, low and closing values used in the creation of the standard candlestick chart are calculated differently. The formulas are used in a different way by taking the average of the two periods and candles are formed. I have given an example of this in the screenshot below. As you can see, candlesticks in the heikin-ashi candlestick chart did not start from the closing zone of the previous candle. Candlesticks have started from the middle zone of the previous candle. This is an example of how the candles we described above are formed.
Heikin-Ashi candles have a lower shadow and an upper shadow. In this technique, green candles without a lower shadow indicate a strong uptrend, while red candles without an upper shadow indicate a strong downtrend.
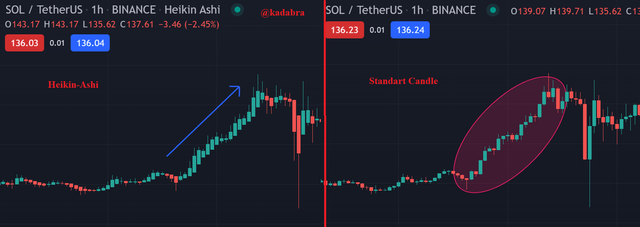
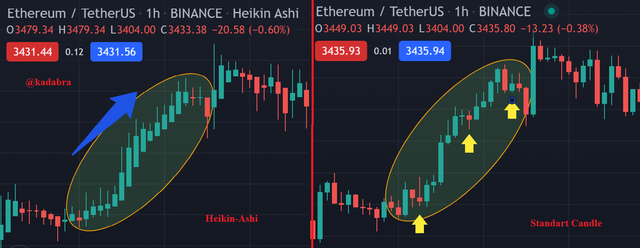
The Heikin-Ashi technique better highlights the trend direction of an asset. In this technique, the market noise is reduced and the trend direction is better emphasized. I showed this situation in the screenshot I shared below. The trend with heikin-ashi in the first screenshot, the trend with the standard candle in the second screenshot.

2-)Make your own research and differentiate between the traditional candlestick chart and the Heikin-Ashi chart.
Although there are similarities between the two candles, there are some differences such as the analysis difference and the formation of the candle. I will talk about these differences with substances.
Candle Pattern
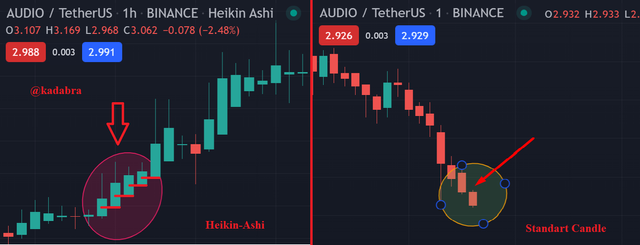
There is a difference in occurrence between the candles on the Heikin-Ashi chart and the candles on the standard candlestick chart. In Heikin-Ashi, candlesticks start from the middle of the previous candlestick. In the standard candlestick chart, if there is no gap, the candles start at the closing level of the previous candle.
Trend Clarity
Market noise is reduced in Heikin-Ashi. As you can see in the screenshot above, the Heikin-Ashi chart highlights the trend much more clearly. Therefore, it is much easier to catch an uptrend or a downtrend with Heikin-Ashi candles.
Color of Candles
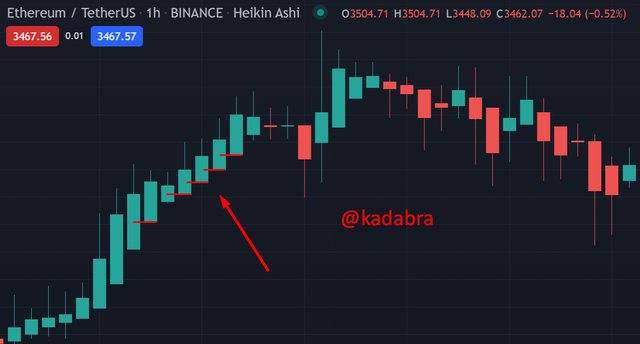
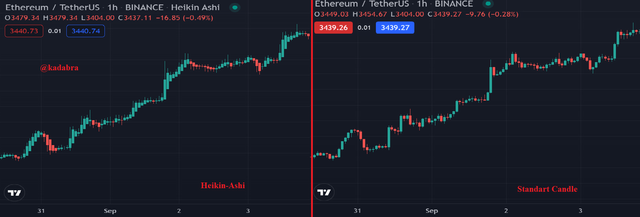
It is easier to interpret the market on the Heikin-Ashi chart. The color of the candles on the heikin-ashi chart does not change often unless there are very large market changes. It helps us to identify the trend most clearly. In the standard candlestick chart, the color of the candles can change even with the slightest market change. This causes us to interpret the market trend more difficult. In the screenshot below, we can see how clearly the heikin-ashi candles show the uptrend.
3-)Explain the Heikin-Ashi Formula. (In addition to simply stating the formula, you should provide a clear explanation about the calculation)
Each candlestick in the Heikin-Ashi candlestick also contains information about price movements in the past period. Heikin-Ashi candlesticks consist of 4 values as in standard candlesticks. These:
Open
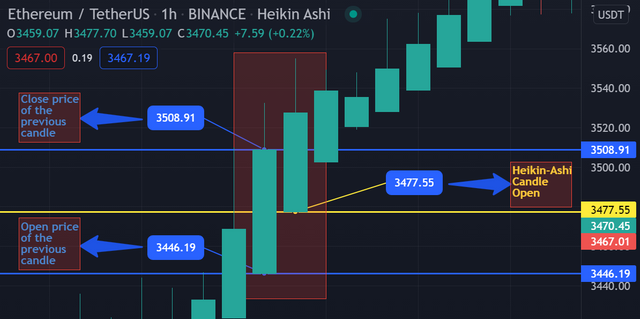
The opening value is equal to the midpoint of the previous candlestick. This is because the opening value is obtained by adding the opening value of the previous candlestick and the closing value and dividing it by two.
Open Formula: (Open price of previous candle + Close price of the previous candle) / 2
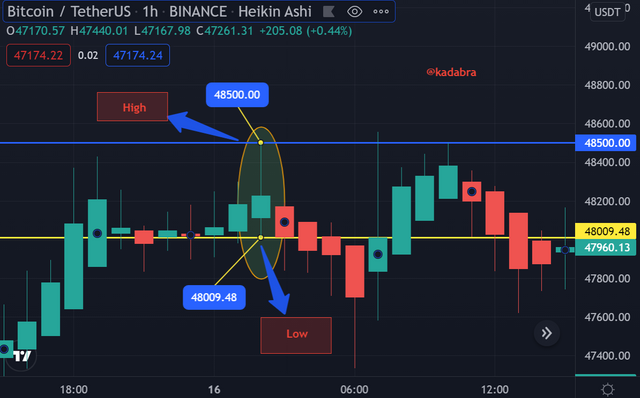
Let's give an example on the graph.
Open price of previous candle:3.446,19$
Close price of the previous candle: 3.508,91$
3.508,91 + 3.446,19 = 6.955,10$
6.955,10 / 2 = 3.477,55 $
Heikin-Ashi Candle Open = 3.477,55 $
Close
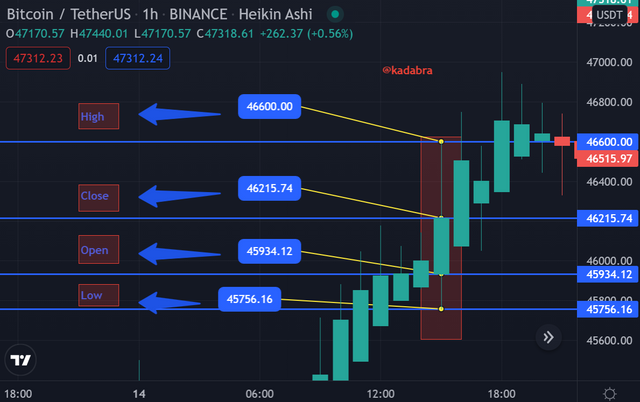
Open, high, low and close prices of the current candle are summed up. Then the result is divided by 4. Thus, close is calculated.
Open Formula: (Open + High + Low + Close ) / 4
Let's give an example on the graph.
Open: 45.934,12$
Close: 46.215,74$
High: 46.600$
Low: 45.756,16$
45.934,12 + 46.215,74 + 46.600 +45.756,16 = 184.506,02
184.506,02 / 4 = 46.126,50
High
It represents the highest value reached by the price between the open and close in the current candle.
Low
It represents the lowest value at which the price falls between the open and close in the current candle.
4-)Graphically explain trends and buying opportunities through Heikin-Ashi Candles. (Screenshots required)
Trends
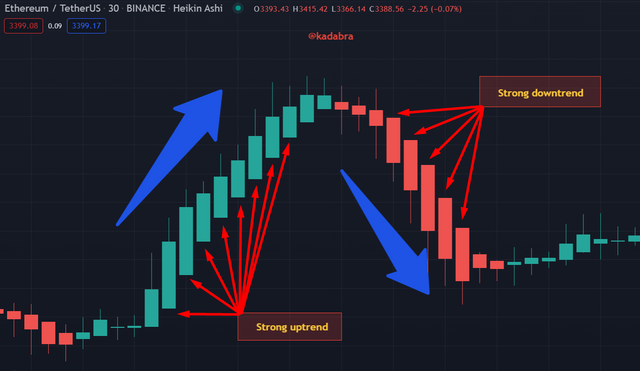
The most common use of Heikin-Ashi is to determine the trend in the market. Using the Heikin-Ashi chart, we can determine the direction and strength of its trend. Green candles without a lower shadow indicate that we are in a strong uptrend. Red candles with no upper shadow indicate that we are in a strong downtrend. As a result, we can determine the trend direction by looking at the candle colors and the strength of the trend by looking at the shadow lengths.
Buying Opportunities
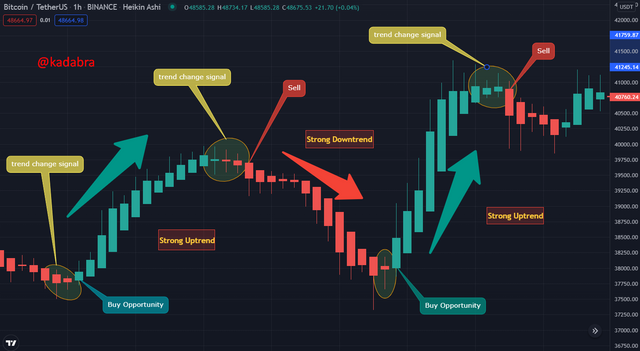
As you know, the heikin-ashi chart gives us clear signals about the direction of the trends. We have given information about the trends above. We can catch the buying or selling opportunities by looking at the shadows of the candles. Small body candles with upper and lower shadows on the Heikin-Ashi chart give us a trend change signal. Investors who want to take risks can enter the asset earlier, while investors who do not want to take risks can enter the position after confirming the trend direction and strength according to the shadows of the candles.
In the chart I shared below, small body candles with upper and lower shadows were formed and gave a signal to the investor that the trend would change. Then, green candles without a lower shadow occurred, that is, a strong upward trend started. Later, small body candles with lower and upper shadows were formed and signaled that the uptrend would change. After this signal, red candles with no upper shadow were formed, that is, a strong downtrend started. Considering these signals, buy or sell position orders can be entered.
5-)Is it possible to transact only with signals received using the Heikin-Ashi Technique? Explain the reasons for your answer.
Trades can be entered just by looking at the Heikin-Ashi chart, but the risk will be higher. Especially in the cryptocurrency market, one should never trade based on a single factor. Because there are many factors that affect the price. The formations on the chart, indicators, as well as news, announcements and developments are also very important. We have experienced this situation frequently in the past months. Due to the negative news on Twitter, the graph analyzes did not work and the prices moved in an unexpected direction. As in all other analyzes, Heikin-Ashi should be supported by other indicators and the position should be entered accordingly. This is a more secure method. However, as I said, there is no such thing as a definite gain, especially in the crypto money market.
6-)By using a Demo account, perform both Buy and Sell orders using Heikin-Ashi+ 55 EMA+21 EMA.
Sell Position:
I saw the 21EMA moving below the 55'EMA before entering the position. This gave the signal for a sell position. After the small body candles with upper and lower shadows, a red candle with no upper shadow was formed. This is the harbinger of a downtrend on the heikin-ashi chart. I entered the sell position after seeing this candle.
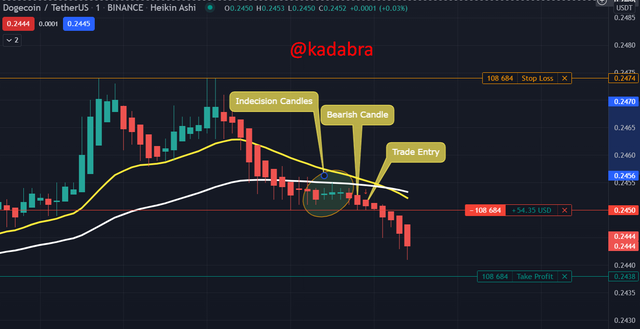
I closed the position with profit before reaching the target. The reason for this is that an upper and lower shadow candle has formed, which can change the direction of the trend.

Buy Position:
In this position, I saw that the 21EMA, which is the opposite of the above situation, went above the 55EMA. I waited a little longer to confirm the buy signal. After a few indecision candles, a green candle with no lower shadow formed. After that point, I entered the position and was able to make a profit.
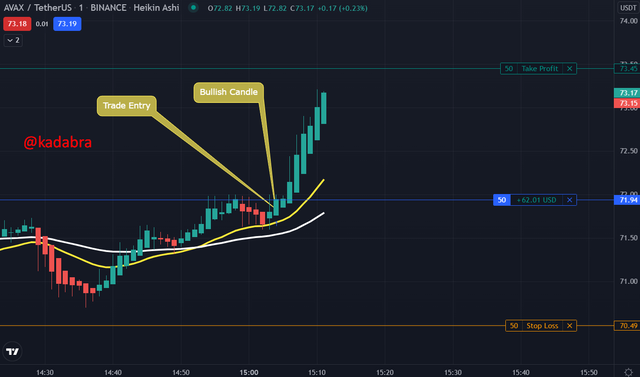
I closed the position with profit before reaching the target. The reason for this is that an upper and lower shadow candle has formed, which can change the direction of the trend.

Conclusion
In this homework, we learned about the Heikin-Ashi technique and practiced from the demo account. After doing some research, it is possible to use this technique easily. It just takes some practice. In the last question of this homework, we practiced the technique by adding EMA to the chart.
We can support our analysis and increase our profit rate by using other indicators, not just the 21-55 EMA. But there is no certainty that the signals will be absolutely correct. Therefore, it is necessary to be very careful not to make big losses in the market. We know that anything can happen at any time, especially in the cryptocurrency market.
It was a very informative and instructive homework for me.
Thanks.