Steemit Crypto Academy Season 2-Week6 | MACD indicator from @kouba01 | Indicador MACD por: @juanjo09 ES/EN
Un gran saludo a todos mi amigos, alumnos y maestros de la #cryptoacademy siguiendo con el gran curso de marcadores tecnicos de @kouba01. En esta oportunidad nos toca discutir sobre el indicador MACD, expondré aspectos practicos y teoricos del marcador, Empecemos.
A big greeting to all my friends, students and teachers of the #cryptoacademy following with the great course of technical markers of @kouba01. This time we have to discuss the MACD indicator, I will expose practical and theoretical aspects of the scoreboard, let's get started.
Introducción
Introduction
MACD (Moving Average Convergene Divergence) es uno de los indicadores tecnicos mas populares y se vuelve impresindible conocerlo para orientarnos en el mercado y es que nos brinda informacion sobre la fuerza y tendencia de mercado.
MACD (Moving Average Convergene Divergence) is one of the most popular technical indicators and it becomes essential to know it to guide us in the market and it gives us information on the strength and trend of the market.
En este post discutiremos y responderemos a las preguntas dadas por el profesor @kouba01 en su conefencia sobre el indicador MACD (vease aquí) donde la intencion es exponer en gran medida como se emplea este indicador en la practica, por tanto, recurriré a mencionar solo algunos conceptos basicos pero en gran medida se detallara como se utilizada, configura y manipula el marcador MACD para un analisis tecnico.
In this post we will discuss and answer the questions given by professor @ kouba01 in his knowledge about the MACD indicator (see here) where the intention is to largely expose how this indicator is used in practice, therefore, I will resort to mentioning only some basic concepts but largely It will detail how the MACD marker is used, configured and manipulated for a technical analysis.
¿Que es el indicador MACD?
What is the MACD indicator?
El MACD es un indicador que fue desarrollado por Gerald Appel en la decada del 1970, este nos revela información sobre los cambios de fuerza, dirección, impulso y duración de una tendencia, esta señal para ser estructurada depende de tres parametros que se exponen en el marcador.
The MACD is an indicator that was developed by Gerald Appel in the 1970s, it reveals information about the changes in strength, direction, momentum and duration of a trend, this signal to be structured depends on three parameters that are exposed in the marker.
- La línea MACD
- La línea de señal
- Histograma
- The MACD line
- The signal line
- Histogram
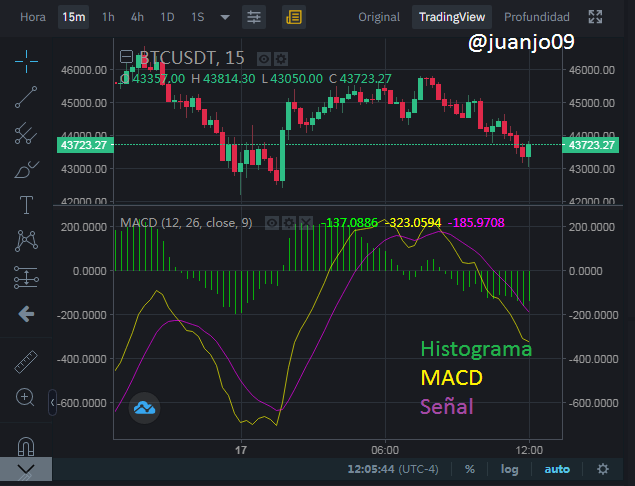
Donde la linea MACD (linea amarilla) determinar el "momentum" ya sea alcista o bajista, es decir, la tendencia de mercado. Esta se calcula restando dos medias móviles exponenciales (EMA) asi como @kouba01 nos enseña en su conferencia antes citada.
Where the MACD line (yellow line) determine the "momentum" either bullish or bearish, that is, the market trend. This is calculated by subtracting two exponential moving averages (EMA) as @kouba01 teaches us in his above-mentioned lecture.
La linea de señal (linea fucsia) es habitualmente una EMA de 9 periodos que se combina con la señal MACD
The signal line (fuchsia line) is usually a 9 period EMA that is combined with the MACD signal
y el histograma (en verde) representa gráficamente de la divergencia y convergencia de las líneas anteriores (MACD y Señal)
and the histogram (in green) graphically represents the divergence and convergence of the previous lines (MACD and Signal)
¿Es el indicador MACD bueno para operar con criptomonedas?
Is the MACD indicator good for trading cryptocurrencies?
Por su puesto que si, el indicador MACD es uno de los indicadores técnicos mas usados junto al RSI y es que nos revela información sobre la tendencia del mercado lo que nos ayuda a orientarnos en el trading y cuando seria bueno o no vender o comprar.
Of course, yes, the MACD indicator is one of the most used technical indicators together with the RSI and it is that it reveals information about the market trend which helps us to orient ourselves in trading and when it would be good or not to sell or buy.
¿Qué es mejor, MACD o RSI?
Which is better, MACD or RSI?
En la clase pasada de @kouba01, entendimos y definimos el índice de fuerza relativa (RSI) Que igual es una herramienta que nos revela cierta información sobre la sobre la tendencia y orientación del mercado, entonces aquí entra una pregunta relevante ¿Es mejor el MACD que el RSI? en mi opinión no, ni tampoco el RSI es mejor que el MACD y es que ambos se suelen usar en conjunto pues, tanto el MACD como el RSI puede darnos datos equivocados o falsas señales por si solos por tanto usar los dos es la mejor opción. Por otro lado hay que aclarar que el indicador MACD es muy fácil de usar y de interpretar, aunque el RSI no es tan comoplejo el MACD es mucho mas intuitivo.
In the last class of @kouba01, we understood and defined the Relative Strength Index (RSI) That it is still a tool that reveals certain information about the trend and orientation of the market, so here a relevant question comes in.Is the MACD better? than the RSI? In my opinion, no, nor is the RSI better than the MACD and both are usually used together because both the MACD and the RSI can give us wrong data or false signals by themselves, therefore using both is the best option . On the other hand, it must be clarified that the MACD indicator is very easy to use and interpret, although the RSI is not as complex, the MACD is much more intuitive.
¿Cómo agregar el indicador MACD al gráfico, cuáles son sus configuraciones y formas de beneficiarse de ellas?
How to add the MACD indicator to the chart, what are its settings and ways to profit from them?
En cualquier Tradeview debe poder agregarse los indicadores tecnicos, dare un ejemplo de esto con el tradeview de Binance, veamos como colocarlo en la grafica.
In any Tradeview it should be possible to add the technical indicators, I will give an example of this with the Binance tradeview, let's see how to place it on the chart.
Abrimos Binance, luego de escoger cualquier par (BTC/USDT en este caso) nos aseguramos que se encuentra en la pestaña de tradingview.
We open Binance, after choosing any pair (BTC / USDT in this case) we make sure that it is in the tradingview tab.

Luego nos dirigimos a la seccion de indicadores tecnicos, en Binance es un pequeño icono que nos aparece en la parte superior de la grafica.
Then we go to the technical indicators section, in Binance it is a small icon that appears at the top of the chart.

Luego nos abre una pequeña ventana con todo el conjunto de indicadores tecnico que ofrece el tradingview de Binance, aqui buscamos el indicador que deseamos, en este caso el MACD
Then it opens a small window with the entire set of technical indicators offered by the Binance tradingview, here we look for the indicator we want, in this case the MACD
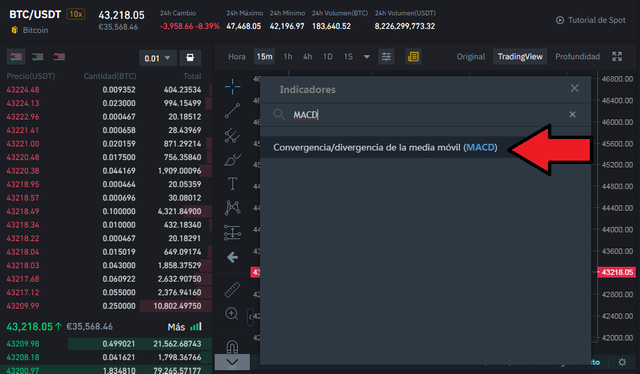
al seleccionarlo ya nos aparece el indicador en la grafica...
When selecting it, the indicator appears on the graph ...
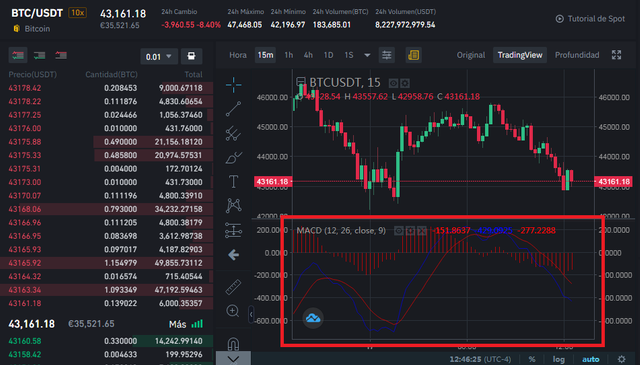
Ahora podemos darle en configuraciones del indicador (en pequeño icono de tuerca, que casi no se ve)...
Now we can give it in the indicator settings (in the small icon of the nut, which is hardly visible) ...
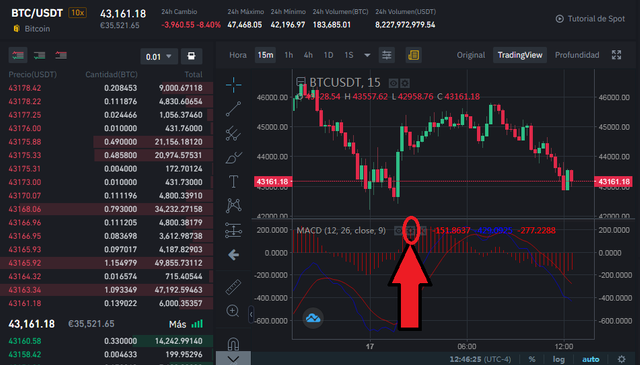
En esta seccion podemos ajustar algunos datos, o personalizar las lineas, yo prefiero colocarlos en colores algo mas claros, para que no hagan tanto ruido visual al contrastar con un fondo oscuro.
In this section we can adjust some data, or customize the lines, I prefer to place them in somewhat lighter colors, so that they do not make so much visual noise when contrasting with a dark background.
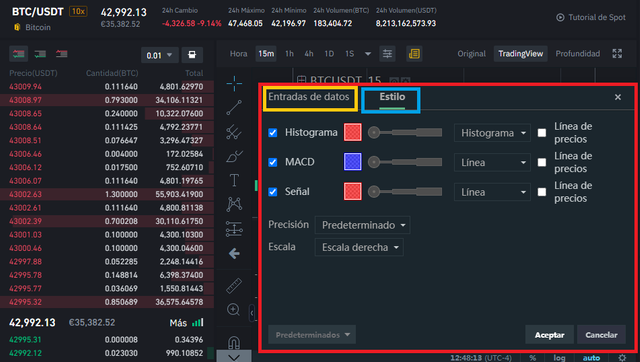
el indicador MACD podemos cambiarle los datos de entrada y es que podemos personalizar sus valores para obtener resultados deseados, por ejemplo veams que pasa si escojemos la opcion de entrada de datos en el indicador MACD en Binance.
The MACD indicator we can change the input data and we can customize its values to obtain desired results, for example see what happens if we choose the data entry option in the MACD indicator in Binance.
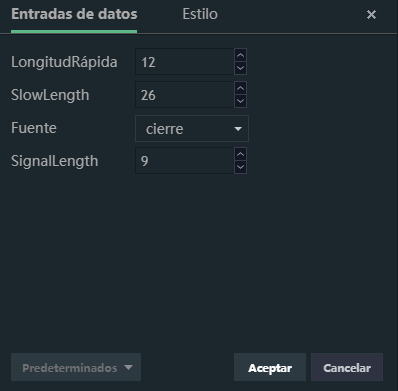
Podemos ver que tenemos cuatro parámetros que podemos cambiar.
We can see that we have four parameters that we can change.
Logitud rapida (FastLength): Define la longitud de EMA rápida la menor por lo general esta longitud se mantiene en 12
Longitud Lenta (SlowLength): Define la longitud EMA lenta la mas larga, por lo general esta se mantiene en 26
Fuente (Source): Este valor le dice al indicador que tipo de precio debe tomar en cuenta ya sea el precio de cierre, el precio de apertura, el precio máximo, mínimo, etc...
longitud de señal (SignalLength): nos define la longitud de lectura de la linea de señal.
Fast Length (FastLength): Defines the length of the fast EMA the smallest, usually this length is kept at 12
Slow Length (SlowLength): Defines the slowest EMA length the longest, usually this is kept at 26
Source (Source): This value tells the indicator what type of price it should take into account, be it the closing price, the opening price, the maximum price, the minimum price, etc ...
signal length (SignalLength): defines the reading length of the signal line.
Recordemos que el MACD se calcula como la diferencia entre dos EMA de longitudes diferentes, estos valores son por supuesto que alterables pero debemos recordar que mientras mas grande sea el EMA mas rápido entonces el valor MACD sera mas positivo, de modo que si la longitud rápida se coloca mayor a al EMA lento, la gráfica sufrirá un cambio de polarización (veremos todo al revés).
EMA, the faster then the MACD value will be more positive, so if the fast length is placed higher than the slow EMA, the graph will undergo a polarization change (we will see everything the other way around).
En el mundo cryptografico los precios suelen ser muy volátiles, lo que nos deja en una posición en que no deberíamos configurar el indicador MACD de modo que sea mas sensible ya que podríamos recibir falsas señales.
In the cryptographic world, prices are usually very volatile, which leaves us in a position where we should not configure the MACD indicator so that it is more sensitive since we could receive false signals.
para controlar los valores del MACD para que sean mas sensible a los cambio podríamos aumentar la diferencia de los EMA del MACD y reducir el periodos. Algunos Analistas técnicos suelen poner los valores del MACD en (5,35,5) esto aumenta la sensibilidad pero no debería alterarse
To control the MACD values so that they are more sensitive to changes, we could increase the difference of the MACD EMAs and reduce the periods. Some technical analysts usually put the MACD values at (5,35,5) this increases the sensitivity but should not be altered
¿Cómo utilizar MACD para cruzar la línea MACD y la línea de señal? ¿Y cómo utilizar el MACD con el cruce de la línea cero?
How to use MACD to cross the MACD line and the signal line? And how to use the MACD with the crossing of the zero line?
Entremos en la interpretación de datos del indicador MACD para esto conozcamos dos patrones a interpretar en el indicador MACD
Let's get into the data interpretation of the MACD indicator for this, let's know two patterns to interpret in the MACD indicator
- Cruce de la linea MACD con la Linea de Señal: Aqui hay solo dos casos
- ** Crossing the MACD line with the Signal Line: ** Here there are only two cases
Caso I: Cuando el cruce de la línea MACD con la de Señal se produzca de abajo a arriba, la señal será alcista, podemos verlo a continuacion.
** Case I: ** When the crossing of the MACD line with the Signal line occurs from bottom to top, the signal will be bullish, we can see it below
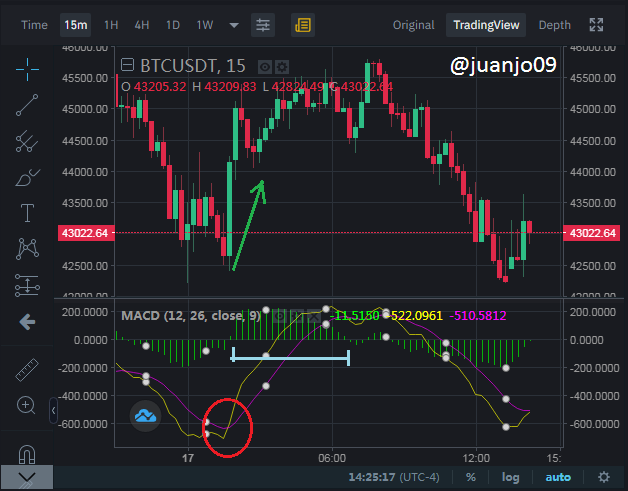
podemos ver la tendencia alsista indicada por el cruce entre el MACD y la linea de señal, y efectivamente el precio subio.
We can see the bullish trend indicated by the cross between the MACD and the signal line, and indeed the price rose.
Caso II: Cuando el cruce de la línea MACD con de Señal se produzca de arriba abajo la señal será bajista. veamos un ejemplo
** Case II: ** When the crossing of the MACD line with the Signal line occurs from top to bottom, the signal will be bearish. let's see an example

Aquí podemos ver entonces el descenso de los precio y el cruce de las lineas en el marcador MACD
Here we can see then the decline in prices and the crossing of the lines on the MACD marker
- El indicador MACD con la linea central:
- ** The MACD indicator with the center line: **
Para esto es muy sencillo, el indicador se mueve entre valores positivos y negativos, cuando la linea MACD se encuentra en la zona negativa, por debajo de la linea cero surgen impulsos bajistas mas intensos, mientras que si esta se encuentra en la zona positiva, por encima de la linea cero, los precios tendrar mas empuje alcista.
For this it is very simple, the indicator moves between positive and negative values, when the MACD line is in the negative zone, below the zero line there are more intense downward impulses, while if it is in the positive zone, Above the zero line, prices will have more upward momentum.

por tanto, podemos observar en la grafica que el BTC/USDT tendra impulsos bajistas mas notables que alsista, ya que se encuentra por debajo de la linea cero.
Therefore, we can see in the graph that the BTC / USDT will have more notable downward impulses than upside, since it is below the zero line.
¿Cómo detectar una tendencia usando el MACD? ¿Y cómo filtrar las señales falsas?
How to detect a trend using the MACD? And how to filter false signals?
Ademas del análisis de linea cero y cruce de linea, el indicador MACD muchas veces nos ofrece otra información para indicarnos las tendencia y posibles tendencias futuras en el mercado para esto debemos conocer como filtrar estas señales y no confundirlas con falsos positivos o falsos negativos. Conozcamos entonces las divergencias del indicador MACD.
In addition to the zero line and line crossing analysis, the MACD indicator often offers us other information to indicate the trends and possible future trends in the market, for this we must know how to filter these signals and not confuse them with false positives or false negatives. Let us know then the divergences of the MACD indicator.
Las divergencias presentes en el marcador MACD y la grafica de precios son vitales ya que muchos dicen que suele ser las mas importantes y muchas veces precisas conozcamos algunas...
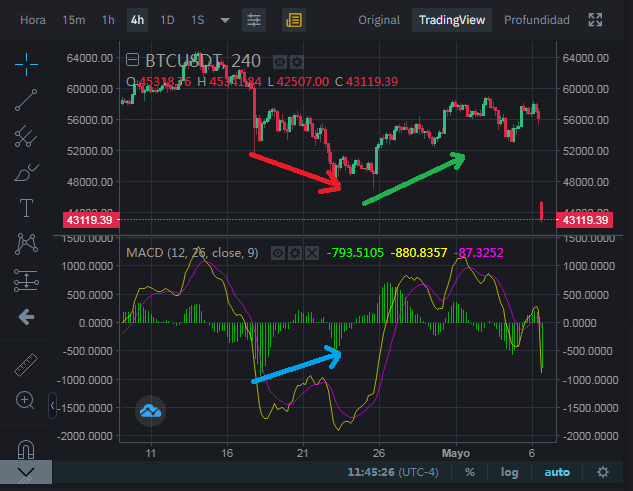
veamos esta gráfica del BTC/USDT, si observamos el histograma, los volúmenes bajo la linea cero están en acenso mientras que la gráfica los picos mínimos están en descenso esto es una divergencia muy popular y si o si, indica una subida de precio por tanto es una oportunidad de compra imperdible.
Let's see this graph of the BTC / USDT, if we look at the histogram, the volumes below the zero line are on the rise while the chart the minimum peaks are on the decline this is a very popular divergence and yes or yes, it indicates a price rise therefore it is an unmissable purchase opportunity.
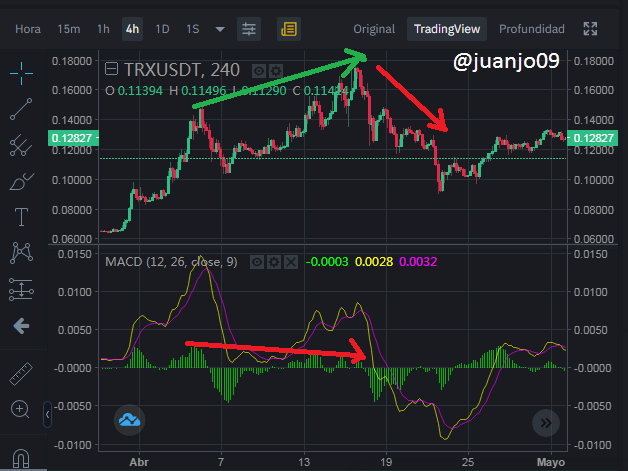
veamos otra divergencia por ejemplo en el par TRX/USDT donde el descenso de los picos del histograma no tienen congruencia con los maximos en acenso de la grafica de precios, lo que nos indica un descenso de los precios.
Let's see another divergence for example in the TRX / USDT pair where the decline of the peaks of the histogram do not have congruence with the rising highs of the price chart, which indicates a decline in prices.
Filtrado de señales
Signal filtering
Muchos suelen filtrar las señales alterando los valores del marcador MACD, sin embargo en el mercado criptografico, las criptodivisas suelen ser muy volátiles lo que causa muchas veces señales falsas es mejor reducir la sensibilidad de los cambios que aumentarla para no mal interpretar la información dada por el marcador.
Many tend to filter the signals by altering the values of the MACD marker, however in the crypto market, cryptocurrencies tend to be very volatile, which often causes false signals, it is better to reduce the sensitivity of the changes than to increase it so as not to misinterpret the information given by marker.
Por otro lado, hay señales que podemos interpretar que muchos pueden leer como falsas señales, hablemos del rechazo de la linea cero y las continuaciones de tendencia según el histograma
On the other hand, there are signals that we can interpret that many can read as false signals, let's talk about rejection of the zero line and trend continuations according to the histogram
Cuando el histograma, rechaza la linea cero podemos intuir que la tendencia no cambiara sino que seguira en tendencia ya sea bajista o alcista, veamos un ejemplo...
When the histogram rejects the zero line, we can intuit that the trend will not change but will continue to trend either bearish or bullish, let's see an example ...
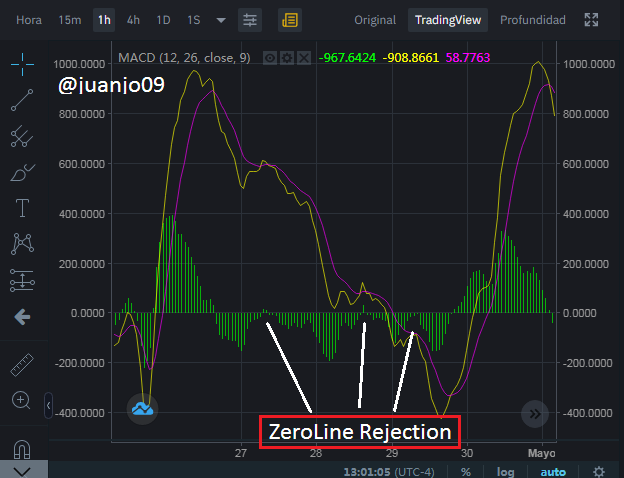
Podemos ver en el histograma un rechazo de la linea cero esto indica (en este caso) una continuacion de la tendencia bajista, por otro, lado todo tiene su final y esto cambiara en algun momento para ello podemos usar las otra herramientas dadas, klas divergencias, etc.
We can see in the histogram a rejection of the zero line this indicates (in this case) a continuation of the downtrend, on the other hand, everything has its end and this will change at some point for this we can use the other tools given, the divergences , etc.
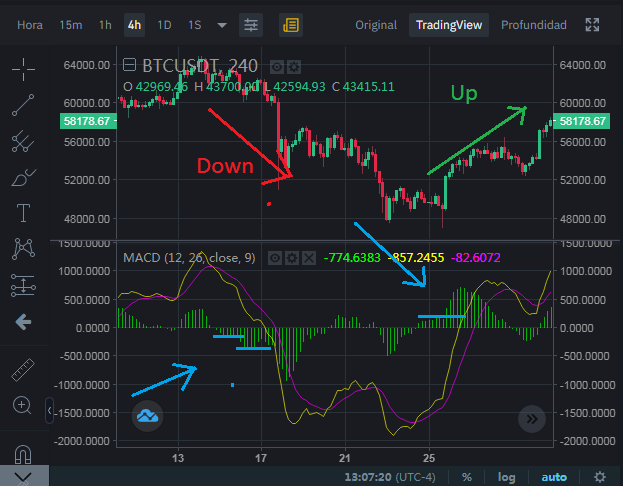
Ahora conozcamos cuando el histograma nos muestra una continuacion de tendencia con, lo que yo llamo, "escalera histografica" cuando vemos que los pulsos del histograma escalan podemos intuir una continuación de tendencia, lo cual es importante a la hora de saber si vender o seguir esperando o comprar o seguir esperando. Veamos un ejemplo.
Now let's know when the histogram shows us a trend continuation with, what I call, "histographic ladder" when we see that the histogram pulses scale we can intuit a trend continuation, which is important when it comes to knowing whether to sell or continue. waiting or buy or keep waiting. Let's look at an example.
¿Cómo se puede utilizar el indicador MACD para extraer puntos o niveles de soporte y resistencia en el gráfico?
How can the MACD indicator be used to extract support and resistance points or levels on the chart?
Podemos deducir barras de resistencia con el apoyo del indicador MACD y es para ello es muy sencillo, según sea lo deseable por el trader puede denotarse lineas de resistencias cuando se cruza la linea MACD con la de señal, estos seria buenos puntos de resistencias ademas de las evidentes en la gráfica de precios. Veamos un ejemplo...
We can deduce resistance bars with the support of the MACD indicator and it is very simple for this, as desired by the trader, resistance lines can be denoted when the MACD line is crossed with the signal line, these would be good resistance points in addition to those evident in the price chart. Let's see an example ...
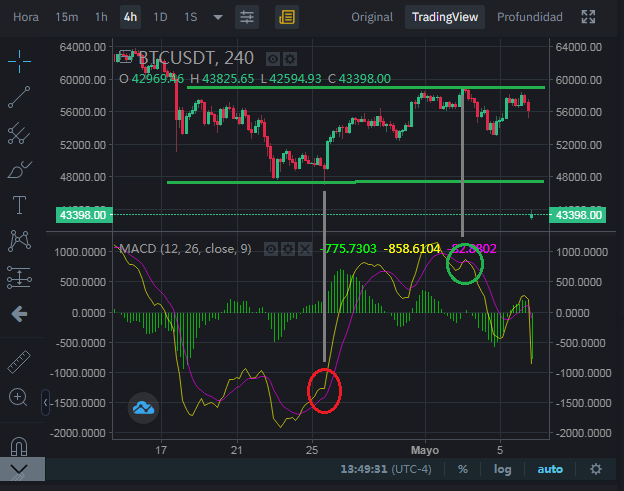
Aquí podemos ver que gracias al marcador MACD podemos definir unos soportes para las variaciones próximas.
Here we can see that thanks to the MACD marker we can define some supports for the upcoming variations.
Revise el gráfico de cualquier par y presente las diversas señales del MACD.
Check the chart of any pair and present the various MACD signals.
Ahora aprovechando el poder del conocimiento veamos un análisis de cualquier par con el indicador MACD. en esta oportunidad usemos el par ETH/USDT
Now taking advantage of the power of knowledge, let's look at an analysis of any pair with the MACD indicator. this time let's use the ETH / USDT pair

Veamos la siguiente grafica y empecemos aver señales del indicador MACD, en primera instacion en el grafico podemos encontrar una divergencia bajista, y al ver la grafica asi paso, bajaron los precios pero no significativamente. Vease los descensos del histograma por encima de la linea cero y que los maxims de la grafica de precios sube.
Let's look at the following graph and begin to see signs of the MACD indicator, in the first instance in the graph we can find a bearish divergence, and when we see the graph as it happened, prices fell but not significantly. See the histogram declines above the zero line and the price chart peaks rise.

Si seguimos viendo el historial de la gráfica podemos encontrar otra divergencia, lo que da surgimiento a otra tendencia bajista, por tanto, podemos decir que los precios del ETH bajaran un poco en las proximas horas.
If we keep looking at the history of the chart we can find another divergence, which gives rise to another downtrend, therefore, we can say that ETH prices will drop a bit in the next few hours.

otra de la informacion que pudimos encontrar a su tiempo en la permanencia de tendencia con la "mini" escalera histografica.
Another piece of information that we were able to find at the time was the permanence of the trend with the "mini" histographic ladder.

Conclusión
Conclution
El marcador MACD es uno de los más conocidos y utilizados junto al RSI y es que la información que nos brindan estos marcadores son muy útiles para orientarnos en estas practicas del trading en son de esto, el indicador MACD me pareció mas fácil que el RSI, sin embargo, mi consejo es no apresurarse o depender solo de este indicador; recordemos que esta es solo una herramienta de todo un conjunto de practicas y conocimientos que debemos ordenar y aplicar para.
The MACD marker is one of the best known and used together with the RSI and the information provided by these markers is very useful to guide us in these trading practices in this way, the MACD indicator seemed easier than the RSI, However, my advice is not to rush or rely only on this indicator; remember that this is only one tool of a whole set of practices and knowledge that we must order and apply for.
Un gran saludo a todos y espero les haya parecido útil, informativa y entretenida mi entrega de hoy
A big greeting to all and I hope my delivery today has been useful, informative and entertaining.
Hello @juanjo09,
Thank you for participating in the 6th Week Crypto Course in its second season and for your efforts to complete the suggested tasks, you deserve a 9/10 rating, according to the following scale:
My review :
An excellent article, you passed most of the questions asked which shows the enormous effort in research and writing. What is missing is further analysis of the extraction of support and resistance points using the MACD indicator.
Thanks again for your effort, and we look forward to reading your next work.
Sincerely,@kouba01
Thanks for the prompt revise, this technical indicador seemed very useful. Thank very much.