Crypto Academy | S4W2 - Homework Post for @reddileep | Intermediate : Heikin-Ashi Trading Strategy | by: @juanjo09
Greetings to all my friends and colleagues from the #cryptoacademy this time we will learn about trading strategy applying Heikin-Ashi thanks to the theme encouraged by professor @reddileep with his lecture (See here) provides us with the necessary information to carry out our activity.
In this post, we will learn slightly to recognize, interpret and read information from Heikin-Ashi charts whose main difference from traditional Japanese candles is that the Heikin-Ashi is defined by a mathematical value according to the set, so it is a topic that we must have very find.
without more to say, let's get started.
Q1: Define the Heikin-Ashi technique in your own words
The Heikin Ashi technique, also known as modified Japanese candles, Heiken Ashi "can be translated, from Japanese as" a bar in the middle. "This in the 1700s by Munehisa Homma, and it is not until recently that it has started to spread its use by becoming more popular among today's traders. This technique aims to observe the trend in the charts with greater ease, thus smoothing the typical candlestick charts and eliminating the need to interpret patterns, since The values used to design the candles use the daily price averages to show the movement of the average price of an asset.
Although this technique shows us a more beautiful graph, it must be taken into account that the Heikin Ashi should be a complement to the analysis with other existing means, since when combined with different technical indicators the market analysis can be more effective and the probability trading based on false signals can be reduced, as we are seeing a moving average instead of price.
Q2: Do your own research and difference between the traditional candlestick chart and the Heikin-Ashi chart.
Heikin ashi
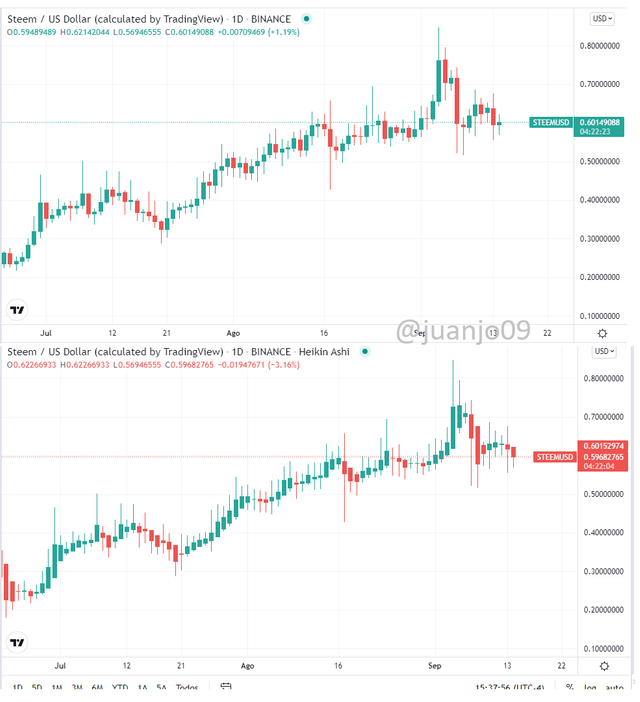
The Heikin Ashi technique gives us a cleaner version of the actions of a price on the chart. Clearly marking up and down movements.
It shows us an average version of the opening, closing, maximum and minimum that is based on the data of the previous candles to calculate the price of the current one.
It shows us the representation of the entire trend in a single color, if it is bullish in a green color, and if it is bearish in red.
With this technique it is simple to deduce when the trend remains in the market, therefore a trader will know when to stay in a trade or close it due to the signals it offers.
Traditional japanese candles
Traditional candles show the noise of strong price changes which do not consist of a single line as they show information on each one.
This also shows us the raw open and close maximum and minimum prices of a particular bar, therefore it ends up offering us much more information.
Unlike Heikin Ashi, traditional candles do not cover the gaps or eliminate the information offered by each candle, so its color will be determined by the opening, closing, maximum and minimum price.
As there is no way to reduce the noise, it is not possible to clearly see what is happening during the trend.
Q3: Explain the Heikin-Ashi Formula. (In addition to simply stating the formula, you should provide a clear explanation about the calculation)
As I said at the beginning, this is one of the main distinguishing characteristics of this graph with respect to those of the Japanese candle, the calculation is accompanied by this graph, each one being formed according to data provided previously. Let's analyze a little how these Heikin-Ashi candles are built starting from calculation.
We must remember that the candles are built by an OCHL (Open, Close, High, Low) An entry price, an exit price, a maximum and a minimum.
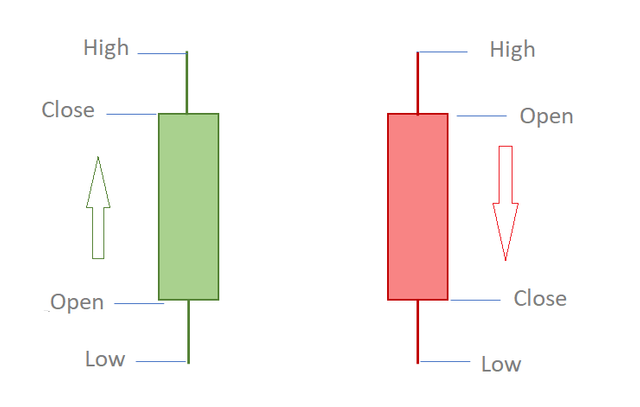
As the Heikin-Ashise chart builds with quantized values with an average value, let's explain each value.
Open:Defines the entry of the candle, this value is an average value between the entry price plus the closing price of the previous candle.
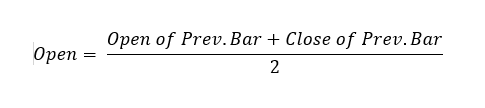
Note that there are two terms in the numerator of the division and in turn this is divided by the number of terms, this is clearly translated as an average.
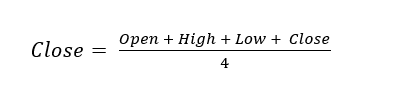
Close: Like the previous one, the closing value is an average value between all the averaged values of the candle, in the same way we see that the numerator has four ternals, this is the value of the denominator to average the numerical value represented in the graph.
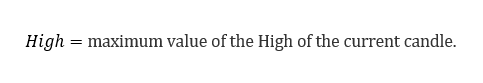
High:This value is defined by the maximum value among all the parameters of the current candle.
Low: This value is defined by the minimum value among all the values of the current candle.
With this we can understand that a large part of the difference of these candles with the traditional Japanese candles is that the Heikin-Ashi are softened thanks to the average of the values.
Let's do an example, let's find the Open value of a Heikin-Ashi candle let's look at this of the STEEM / USDT pair
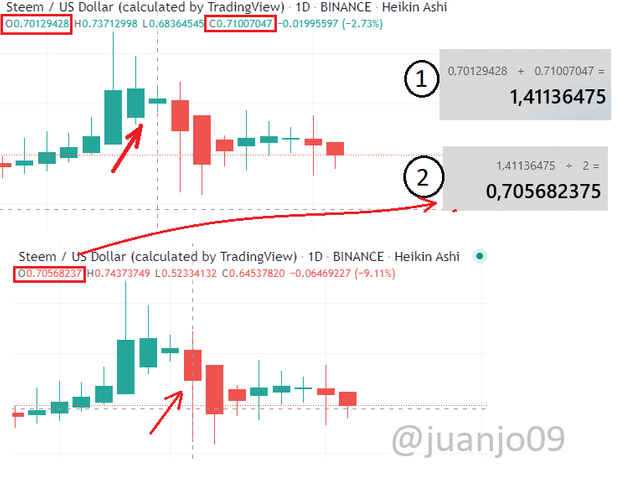
In the upper part of the image we have the Open and Close values indicated in the image we can see in "1" that we add these values, and then in "2" we divide them by 2 (their average) this gives us exactly the value of Open of the candle that precedes the one indicated above.
4- Graphically explain trends and buying opportunities through Heikin-Ashi Candles.
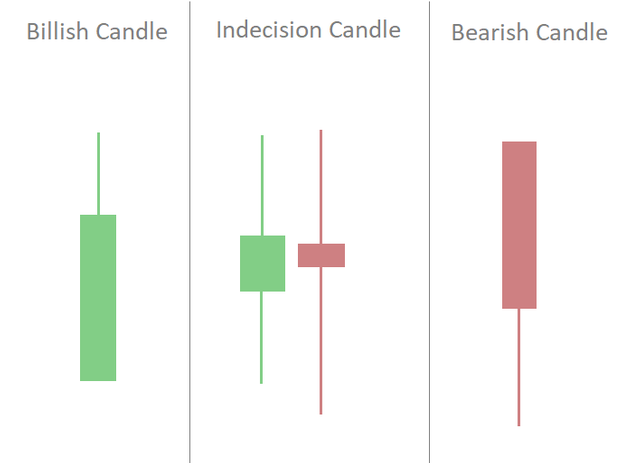
Once we understand that the Heiki-Ashi candles are an average, that is, as a moving average that allows us to analyze, depending on their characteristic shape of a trend or indecision candle, we must then know the appearance of these candles, in the following image we can identify the most common aspect of the three.
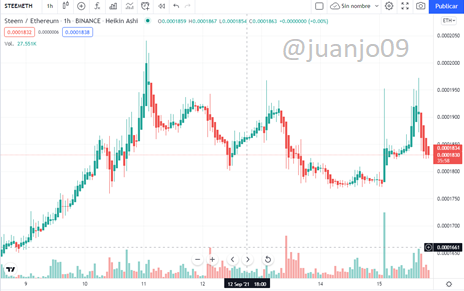
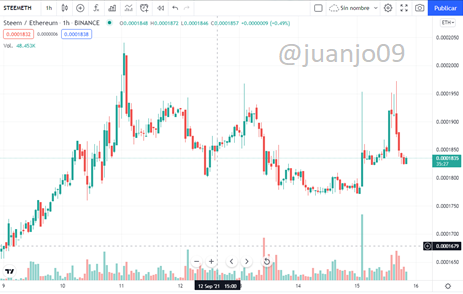
Knowing this classic appearance we can understand and interpret a complete chart, let's see this segment of the STEEM / USDT pair
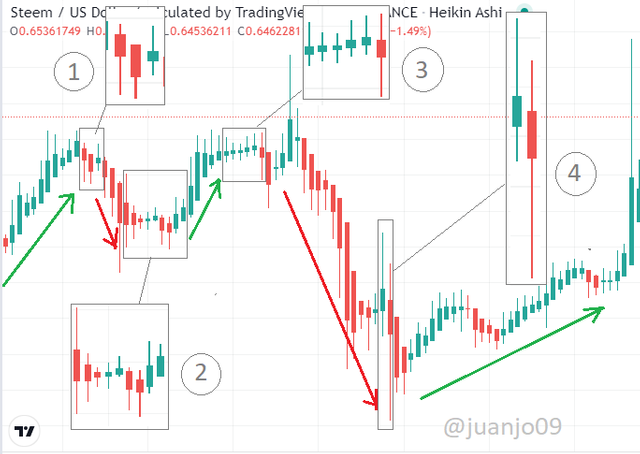
1.- Let's do an analysis little by little, let's see that the graph is found in an upward trend and then at "1" we find three candles, a red indecision candle, then a bearish candle and a green indecision candle, and this indicates us Since the chart may have a price turn, we can see that the next candle is bearish and the price falls sharply.
2.- In "2" we can see a total of 9 candles almost e laterality where the first is a large red indecision candle followed by others of the same type and it is not until the seventh where we find another very common candle pattern "man hanging "after this we see an indecision candle see and culminating with a bullish candle here it indicates a return to the uptrend.
3.- At "3" after the price rise, there are a large number of indecision candles with a very flat body and very large mechanics, at this point we must intuit a price decrease, however notice a defect and is that if we had opened a short trade and placed a stop loss, we would probably have lost the position due to the large candle that caused our stop loss to fly, however, after this we can see that large expected decline.
4.- The descent of "3" does not stop until "4" where we can see two large indecision candles, and here we can sense a stop in the downtrend.
5- Is it possible to carry out transactions only with signals received using the Heikin-Ashi technique? Explain the reasons for your answer.
As we know, technical indicators are not one hundred percent reliable or accurate. Although the Heikin-Ashi can be a versatile tool, it only smoothes out price volatility, therefore it is not a representation format like Japanese candles since it is not tracking the price which adds delays causing loss of resolution and precision.
These candles may be a very good tool to evaluate trends, but they do not really give us the complete information that we should have, for example, Heikin-Ashi candles only indicate trends and moments of indecision on the chart, however, they do not It reveals information about the force, or entry points, not good Stop Loss places among many other aspects. Therefore, it is not very suitable for active traders (day traders or scalpers) to use this tool, because being based on information from two periods (the current and the previous one) each candle will take longer to develop.
So we can summarize the useful features of the Heiki-Ashi chart in:
- Reveals clear and graphical information about the price trend
- Indecision in the price action
On the other hand, relevant information where the Heiki-Ashi do not provide us with specific or clear information is:
- Market strength
- Status of over purchase / sale
- Price turns
- Entrances and exits, among others.
Finally, if you want a more precise alternative, we can add a correctly adjusted moving average, which is more versatile and accurate than the Heikin Ashi formulas. Taking this into account, you should not be a detractor or a defender of this technique, but rather see it as just another tool, which may or may not be of help to you as a trader.
Q6: By using a Demo account, perform both Buy and Sell orders using Heikin-Ashi+ 55 EMA+21 EMA.
To apply a good practice of what I have learned, I will use a demo account that I have had for a while from IQoption, I will implement an operation as required for the activity, for this, I will use some pairs to make operations as indicated by the moving averages and the graph Heikin-Ashi trying to follow a strategy according to the information provided by indicators. Let us begin.
The pair used FILE / USD to change the style of candles we click on the option indicated below
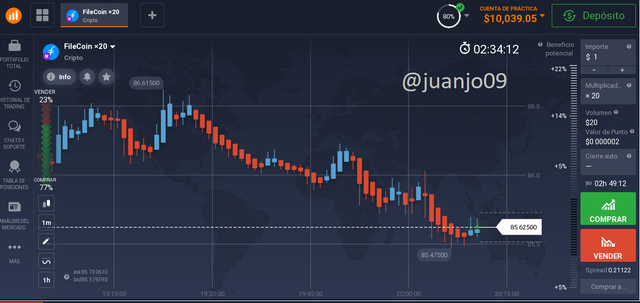
The pair used FILE / USD to change the style of candles we click on the option indicated below
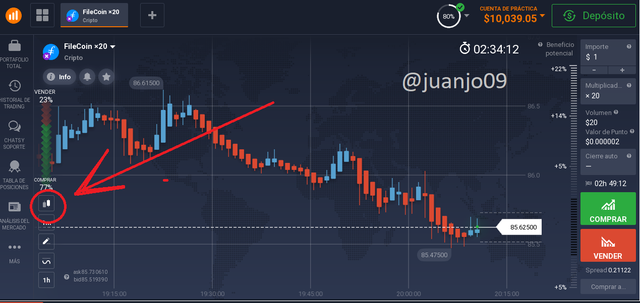
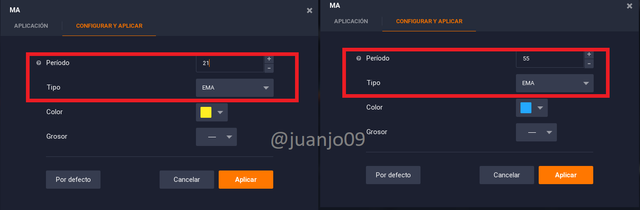
To add the EMA we have a section to add the indicators that we want ...
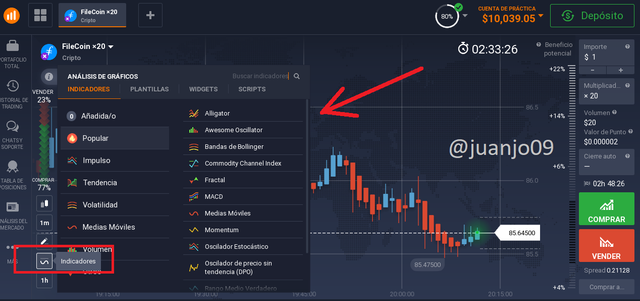
Once here we choose the moving averages, add and configure each one for the chart and follow our strategy. It can be seen that one is an EMA = 21 (Yellow) and an EMA = 55 (Blue)
Now if we can see the moving averages added to the chart, we can only place the chart in a comfortable time frame to operate.
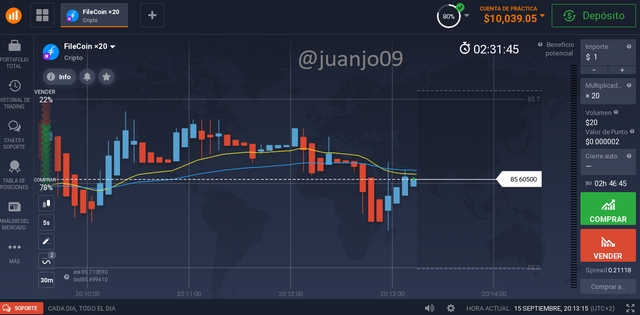
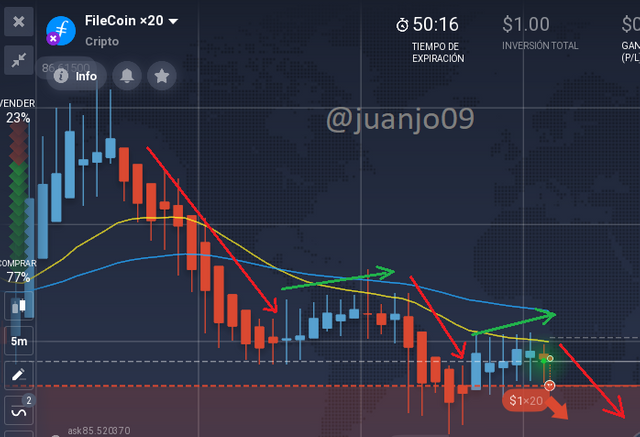
By placing the graph in a more comfortable time frame (5m) we can do a small scalping to see results directly for the task, the first thing we do is orient ourselves in the graph, and the first thing we appreciate is the marked downward trend in which we find ourselves , because we can recognize by Heikin-Ashi the typical bearish candles (a wick at the bottom of the candle)
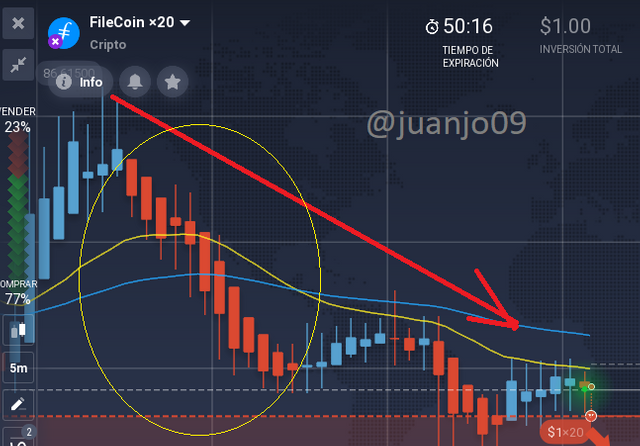
We can also see that the EMA of 21 crosses the EMA of 55 up and down giving us a clear signal of a change in trend, in addition to that right at that moment we see indecision candles, but we see that the price does not take a rise but is a simple correction to trend ...
We can see that the downtrend is clearly strong and that the downtrend pattern is constantly repeated, in addition to the fact that the EMA 21 remains below the EMA 55 confirming the trend, so that the most coherent thing for me would be to start a sell operation. go short, because we have already finished the correction.
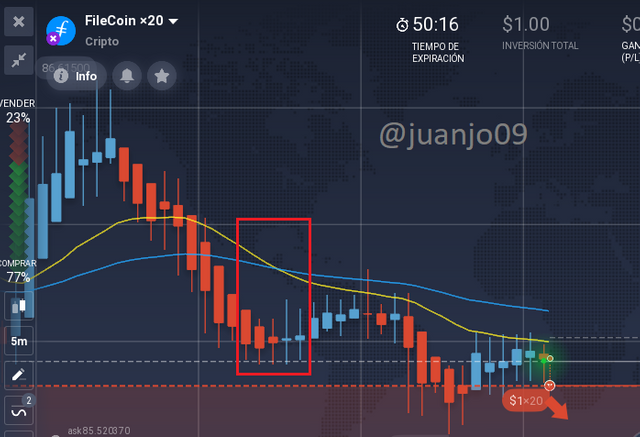
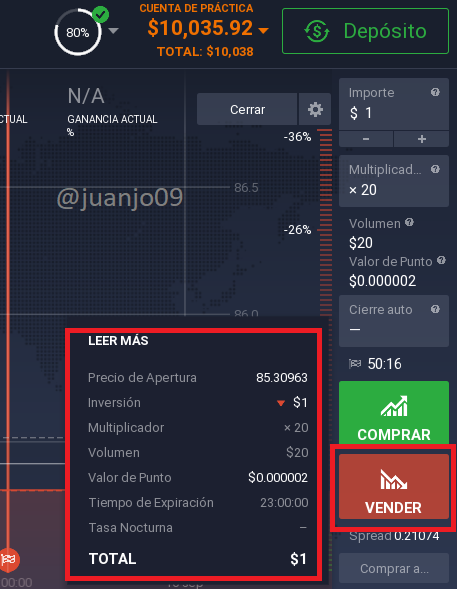
When performing the operation I make it short of $ 1 with a x20
After a while and canceling the operation we can see the entire tour.
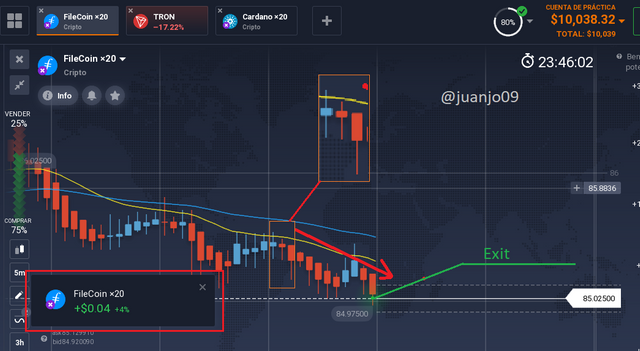
We can see that the start of the short decision was in the orange box, where we can see that the posthumous candle at the time of the first catch was a bearish candle and the price fell, giving us a red square profit.
Conclusion
Heikin-Ashi candles are a good tool to recognize trends, which give us good information when it comes to operating when the trend is marked, however, it is good to have a notion of what they offer, where, it is key to combine it with other tools to have a better notion of the market and operate with greater precision.
Being successful in stock market operations is not defined by what candles you use, but by a large number of techniques and methodologies as a whole, however knowing these types of resources helps us broaden our eyes to the vast world of stock operations.
This is my entire delivery, I hope it has been pleasant and useful for any reader, greetings to all.