
Image created by me on powerpoint
Hi guys,
Welcome to week 4 of the season number 6 in the steemit crypto academy. The professor in the person of
@reminiscence01 in his lecture for this week talked about Psychology of Trends Cycle. This blog of mine is a response to the homework task given by the professor after attending the lecture. Let's get started.
1:-Explain your Understanding of the Dow Jones Theory. Do you think Dow Jones Theory is Important in technical analysis?
Dow Jones theory which was developed by Charles Dow in the year 1897 is indeed a theory that needs to be understand by every crypto trader. According to the theory, Dow clearly stated that a market at any point in time is in either uptrend or downtrend. When ever there is a consistent upward movement I.e the price is making series of higher high and higher low movement, then the trend is bullish in nature. In the same way, When ever there is a consistent downward movement I.e the price is making series of lower low and lower high movement we say the asset is bearish.
From the stated theory above, you will agree with me that the Dow Jones approach is what is used in technical analysis today. Every trader looks out to know the trend direction of an asset before he/she will make any trade entry. This movement as well as change in trend is solely dependant on the demand and supply of an asset. When the demand exceed the supply, the trend will move in an upward direction but when supply exceed demand then the trend will move in downward direction. Furthermore, when both demand and supply are in equilibrium, we say that there is no trend I.e it becomes a sideways movement.
The importance of the Dow Jones theory can never be overemphasised. The reason is that for any trade decision to be made by any crypto trader, the direction of the trend has to be taken into consideration. And from the theory we have seen how to identify this trend direction.
Another importance of the Dow Jones theory is that the volume is use to identify the direction of the trend. When ever we see a higher volume in the market, it means the market is moving along side that volume. So when ever we look at the volume indicator and we see places of higher volume we know that the trend is in that direction.
The phases of the market is also very useful in given details about the trend. Accumulation and reaccumulation phases are phases where the buyers of the asset are buying and holding the asset for some period of time I.e in the accumulation we see a buying pressure indicating that the trend at this point is moving in an upward direction. In the same way, the distribution and redistribution phases are phases where sellers of the asset are selling their asset.
2:-In your own words, explain the psychology behind the Accumulation and Distribution phases of the market. (Screenshots required).
The phases of accumulation and distribution are important phases as far as crypto trading is concern. This phase tells us who is currently in charge of the market at that point in time. Let's consider them one after the other.
Accumulation Phase
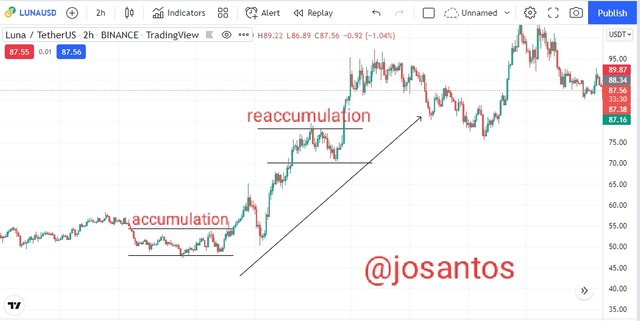
Accumulation phase as the name suggest accumulation is a phase where traders buy asset in a lesser price and hold it for sometime and then sell it when the price is a bit higher. This phase comes mostly after a downtrend movement when the selling pressure in the market is low, the big players then accumulate asset at this point. At this stage, the volume pressure will be low as the volatility in the price of the asset will reduce drastically.
The accumulation phase as I have explained above gives rise to an uptrend movement after some times. When the big players accumulate a lot of the asset, it will force the price to move in an upward direction. Let's consider the screenshot below.
Source
From the chart above, a little more volume was seen injected in to the market and that made the price to break the accumulation phase and then move in upward direction. After a little while, we see a pull back from the upward movement a region we tag as the reaccumulation, here the volume of the asset also decrease implying that there is low volatility.
Source
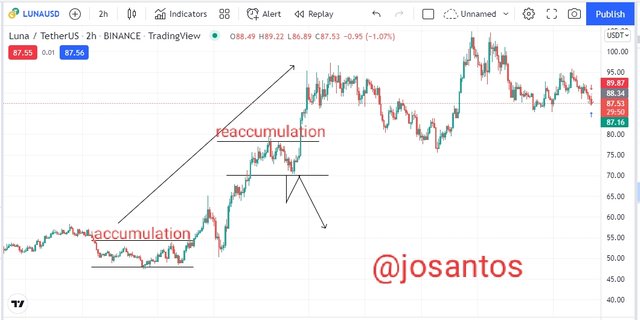
The phase of reaccumulation is a phase that all traders needs to know and also take into consideration, as many traders mistake this phase to a phase of trend reversal. So it is important that traders be on a watchout to be certain that the trend is reaccumulating and not reversing since it has not broken the level and move downward.
Distribution Phase
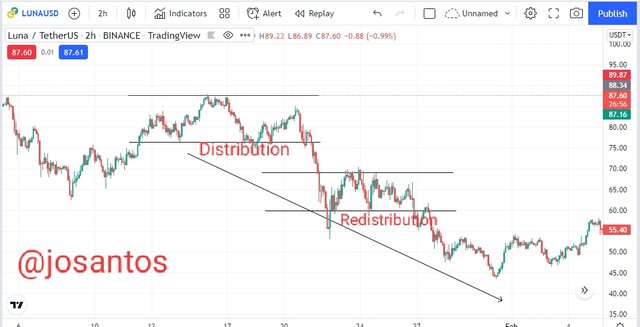
Distribution phase as the name suggest distribution is a phase where traders sell their asset which the have bought sometimes in a lesser price. This phase comes mostly after a uptrend movement when the buying pressure in the market is low, the big players then start selling their asset at this point. At this stage, the volume pressure will be low as the volatility in the price of the asset will reduce drastically.
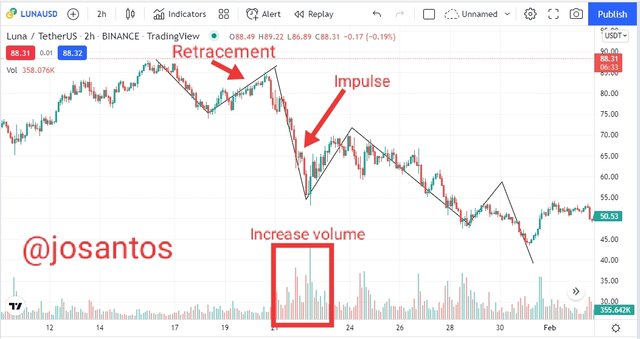
The distribution phase as I have explained above gives rise to an downtrend movement after some times. When the big players distribute a lot of the asset, it will force the price to move in a downward direction. Let's consider the screenshot below.
Source
From the chart above, a little more volume was seen injected in to the market and that made the price to break the distribution phase and then move in downward direction. After a little while, we see a pull back from the downward movement a region we tag as the redistribution, here the volume of the asset also decrease implying that there is low volatility.
Source
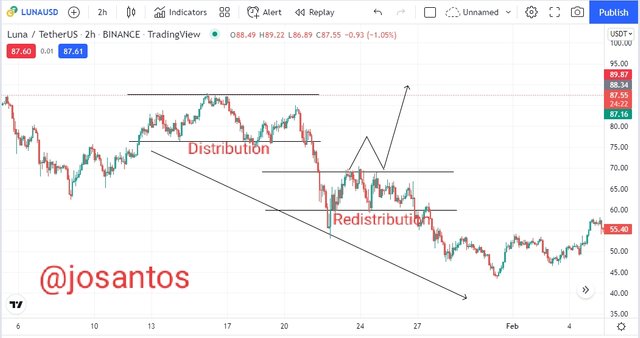
The phase of redistribution is a phase that all traders needs to know and also take into consideration, as many traders mistake this phase to a phase of trend reversal. So it is important that traders be on a watchout to be certain that the trend is redistributing and not reversing since it has not broken the level and move upward.
3:-Explain the 3 phases of the market and how they can be identified on the chart.
The three phases of the market formed as a result of price movement and market structure are the bullish trend, bearish trend and the sideways or range trend. Let's look in-depth at these phases below.
Bullish Trend
A bullish trend is the continuous movement of the price of an asset in an upward direction for a given period of time. When ever we notice the market making series of higher highs and higher lows, then we say the market phase at that point in time is bullish in nature. This trend of the market solely depends on the law of demand and supply. When ever the demand for the asset exceed the supply, the trend moves in an upward direction thereby forming the bullish trend. The screenshot below is an example of bullish trend.
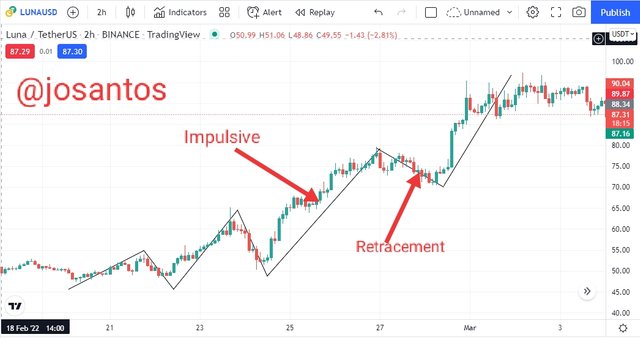
Source
Bearish Trend
A bearish trend is the continuous movement of the price of an asset in a downward direction for a given period of time. When ever we notice the market making series of lower low and lower highs, then we say the market phase at that point in time is bearish in nature. This trend of the market solely depends on the law of demand and supply. When ever the supply for the asset exceed the demand, the trend moves in a downward direction thereby forming the bearish trend. The screenshot below is an example of bearish trend.
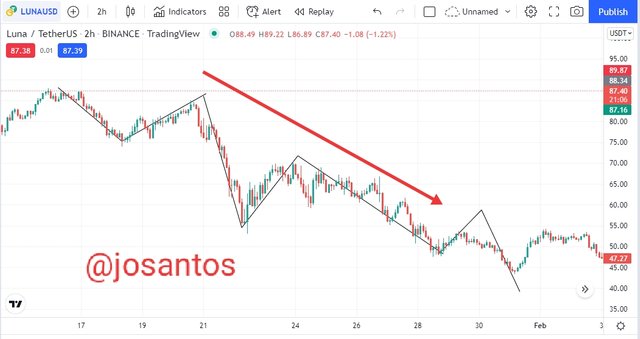
Source
Sideways or Range Trend
A sideways trend is another phase of the market where low volume and less price volatility is seen. Here the market is said to be in equilibrium because both the demand and supply of asset at these point is almost the same. The market at these point is controlled by both buyers and sellers.the range phase is common in the places of accumulation or distribution of an asset. The price at this point will hit the resistance line and bounce back to the support line and hit it as well. This scenario will continue until there is a breakout which will determine the new direction of the trend. Here the trend may continue in the initial direction or it may reverse to an entirely opposite direction. The screenshot below is an example of sideways trend.
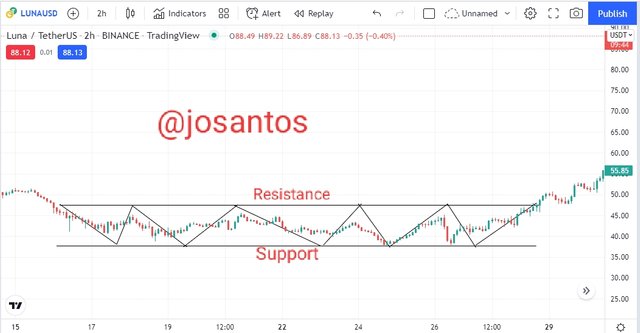
Source
It is important to mention here that the trend of the market can be identify using different means among which are the technical indicators, trendlines, market structure etc. Among all the listed method above, the most reliable one is the market structure. The others can be use as a confirmation tool to determine if the trend direction is right or wrong.
4:-Explain the importance of the Volume indicator. How does volume confirm a trend? Do this for the 3 phases of the market (Screenshots required).
The importance of volume indicator to a trader can never be overemphasised. This is because the volume indicator is use by traders to know the momentum of the market. Increase in the volume indicator signifies increase in the price in either uptrend or downtrend and also it signifies the increase in volatility of the price. In the same way, if the volume decreases it implies that the market may either be in range or the strength of the current trend is exhausted. This simply means that there is a close relationship between the price of an asset and volume.
Uptrend Confirmation Using Volume
In an uptrend movement, the price of the asset continue making series of higher high and higher lows and the volume also continue to increase as well. This is a clear indication that the demand for the asset is higher than the supply of the asset. Let's consider the chart below.
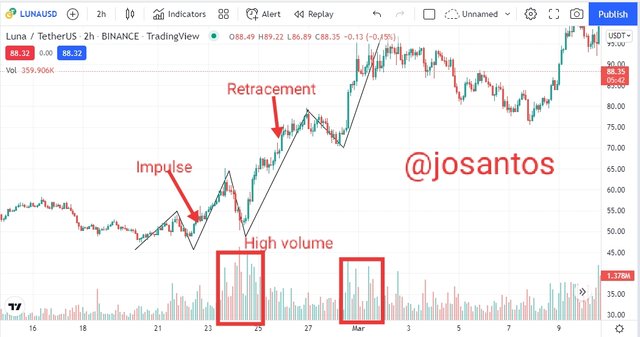
Source
The screenshot above shows the price of the asset moving in the upward direction and the volume also is increasing as I have marked it on the chart above. The upward movement of the price indicates that the asset in the market is completely controlled by buyers at that very point in time.
Downtrend Confirmation Using Volume
In a downtrend movement, the price of the asset continue making series of lower low and lower highs and the volume also continue to increase as well. This is a clear indication that the supply for the asset is higher than the demand of the asset. Let's consider the chart below.
Source
The screenshot above shows the price of the asset moving in the downward direction and the volume also is increasing as I have marked it on the chart above. The downward movement of the price indicates that the asset in the market is completely controlled by sellers at that very point in time.
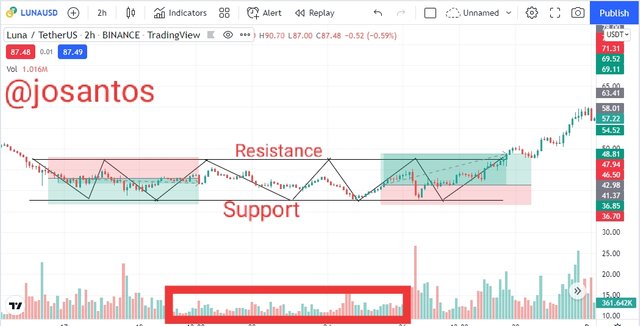
Sideways Confirmation Using Volume
In a sideways movement, the price of the asset at this point is seen moving upward and downward, moving from the level of support to resistance and back to the support level. This upward and downward movement continuous for a period of time. Here in this phase, the asset forms this movement in either the accumulation or distribution phase and the volume here does not increase. The demand and supply for the asset at this phase are seen to be equal or we say they are in equilibrium. Let's consider the chart below.
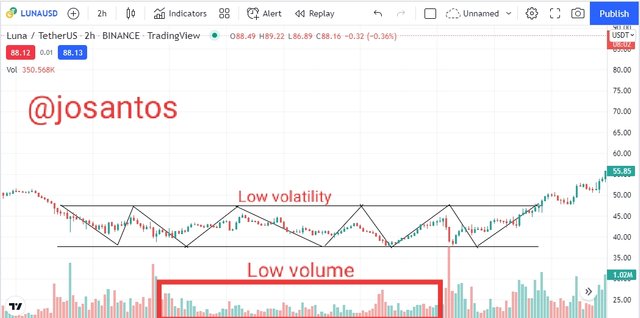
Source
The screenshot above shows the price of the asset moving in sideways for a period of time. As you can see the volume at this phase did not increase because the rate of demand and supply are almost the same. Here in this case the price volatility is very low because of the range movement of the asset.
5:-Explain the trade criteria for the three phases of the market. (show screenshots)
Here in this section, I will be listing out the trade criteria for bullish, bearish and sideways trend trading. Let's get started.
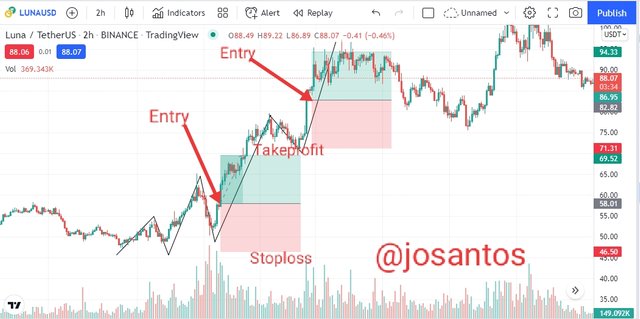
Bullish Trend Criteria
In other to take a position in the bullish trend, the following rules should be taken into consideration.
Firstly, ensure that the price is moving in an upward direction and the volume is increasing as well
Secondly, wait for retracement to the opposite direction of the initial trend and after that wait for a reversal of the trend to the initial trend direction. When that is notice, place you buy entry at the point where a bullish candle is formed.
Your stop loss should be place below the recent low and a risk reward ratio of 1:1 or 1:2 should be used. Let's consider the chart below.
Source
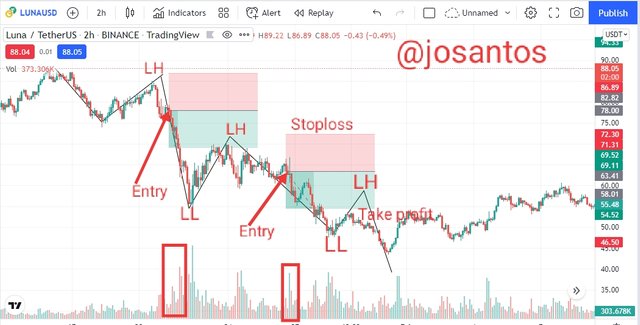
Bearish Trend Criteria
In other to take a position in the bearish trend, the following rules should be taken into consideration.
Firstly, ensure that the price is moving in a downward direction and the volume is increasing as well
Secondly, wait for retracement to the opposite direction of the initial trend and after that wait for a reversal of the trend to the initial trend direction. When that is notice, place you sell entry at the point where a bearish candle is formed.
Your stop loss should be place above the recent high and a risk reward ratio of 1:1 or 1:2 should be used. Let's consider the chart below.
Source
Sideways Trend Criteria
In other to take a position in the sideways trend, the following rules should be taken into consideration.
Firstly, ensure that the market is in a sideways movement by looking at the up and down movement within the support and resistance zone.
Secondly, to place a buy entry, it should be done at the support level with the stop loss below the support level and the take profit close to the resistance level.
Thirdly, to place a sell entry, it should be done at the resistance level with the stop loss a little above the resistance level and the take profit close to the support level. Let's consider the chart below.
Source
6:-With the Trade criteria discussed in the previous question, open a demo trade for both Buy/ Sell positions.
Based on the knowledge acquired from the lecture, I will be using the market structure to analyse my trade using the tradingview.com platform. The trade execution will be carried out on my paper trading account in the tradingview platform. Let's get started.
Buy Posistion
Source
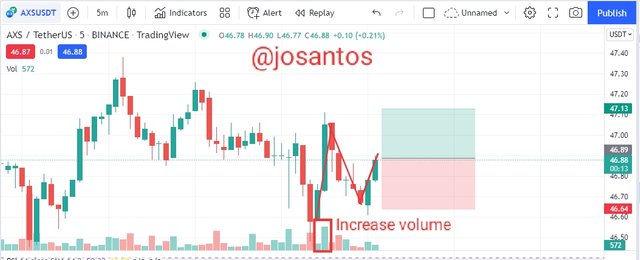
The screenshot above shows a chart of the piar of AXSUSDT on a 5 minutes timeframe. From the chart I observe careful at the points mark that the asset is experience a higher high and higher low movement and also an increase in volume. This is an evidence that the trend is moving in a specified direction in this case upward direction.
I waited for the price of the asset to retrace and form a higher low and I allowed another bullish candle to appear in other to confirm the movement, after confirmation, I entered the trade at that point. See screenshot below.
Source
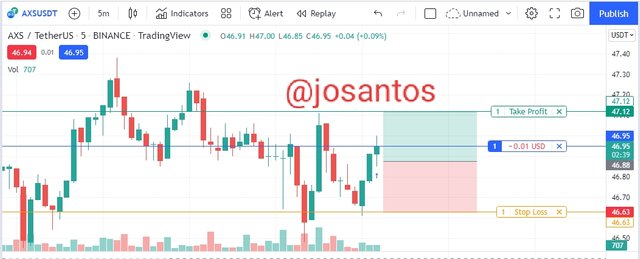
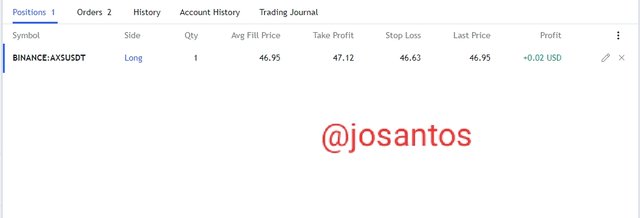
The details of the trade are seen in the chart above, I entered the trade 46.95, and took my profit at 47.12 and set my stop loss at 46.63, the risk reward ratio of 1:1 is used for the trade. The screenshot below shows the running order of the pair of asset.
Source
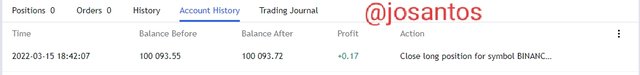
After about some minutes, I checked the trade and I discover that the order has been filled and a profit of +0.17 was made as the asset hit the take profit level.
Source
Sell Posistion
Source
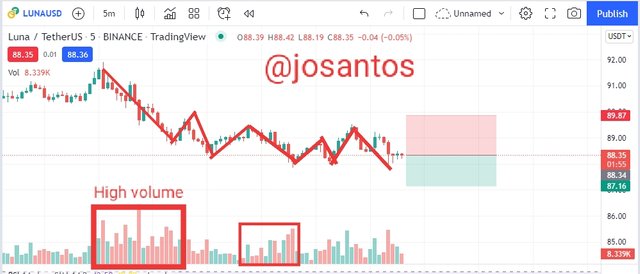
The screenshot above shows a chart of the piar of LUNAUSDT on a 5 minutes timeframe. From the chart I observe careful at the points mark that the asset is experience a lower low and lower high movement and also an increase in volume. This is an evidence that the trend is moving in a specified direction in this case downward direction.
I waited for the price of the asset to retrace and form a lower high and I allowed another bearish candle to appear in other to confirm the movement, after confirmation, I entered the trade at that point. See screenshot below.
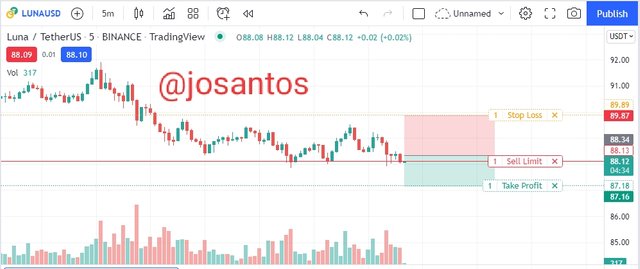
Source
The details of the trade are seen in the chart above, I entered the trade 88.13, and took my profit at 87.18 and set my stop loss at 89.89, the risk reward ratio of 1:1 is used for the trade. The screenshot below shows the running order of the pair of asset.
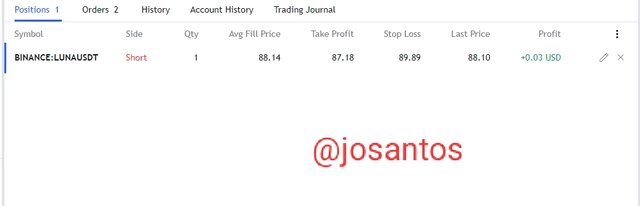
Source
After about some minutes, I checked the trade and I discover that the order has been filled and a profit of +0.96 was made as the asset hit the take profit level.
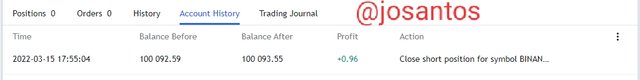
Source
7:-Conclusion.
Trend is no doubt very important in trading as it helps traders to minimize their losses and maximize their profit. In this lecture I have successful discuss the Dow Jones theory and it's importance, I have also showed us how important volume is in the determination of a trend in the three phases of the market. Alot more about making a better trade entry has been discuss extensively in my write up above.
I want to sincerely appreciate the professor
@reminiscence01 for such a wonderful lecture, I have learnt how important the market structure and the volume indicator can be use to make a reliable prediction. I look forward to learning more from you as time goes on.
