Steemit Crypto Academy Season 3 Week 2 - Beginner's Course for professor @reminiscence01| Introduction to Charts by @jollybake

OVERVIEW

A chart is a mathematical drawing or list, showing information arranged in a way that is clear and easy to understand. In forex trading, a trader who wants to go into buying and selling of crypto currency asset must have a full understanding of charts more like price chart because it controls the market, so a price chart, happens to be the first tool that every trader using technical analysis needs to learn.
The changes that occurs in trading like the demand and supply of cryptocurrency is illustrated by the price charts. At every point, the price chart aggregates every buy and sell transaction (currency), it integrate all known news and traders' current expectations of future news and this makes traders adjust to fit it to the market trade.
A bar graph works well with categories while a line graph works well with time.
Explain the Japanese Candlestick Chart? (Chart screenshot required)
Japanese candlestick chart is the best way to virtualize the ups and downs of price to spot potential opportunities for buying or selling. This candlestick charts consists of colours, the green or white represents an increase in price while a red or black represents price decrease.
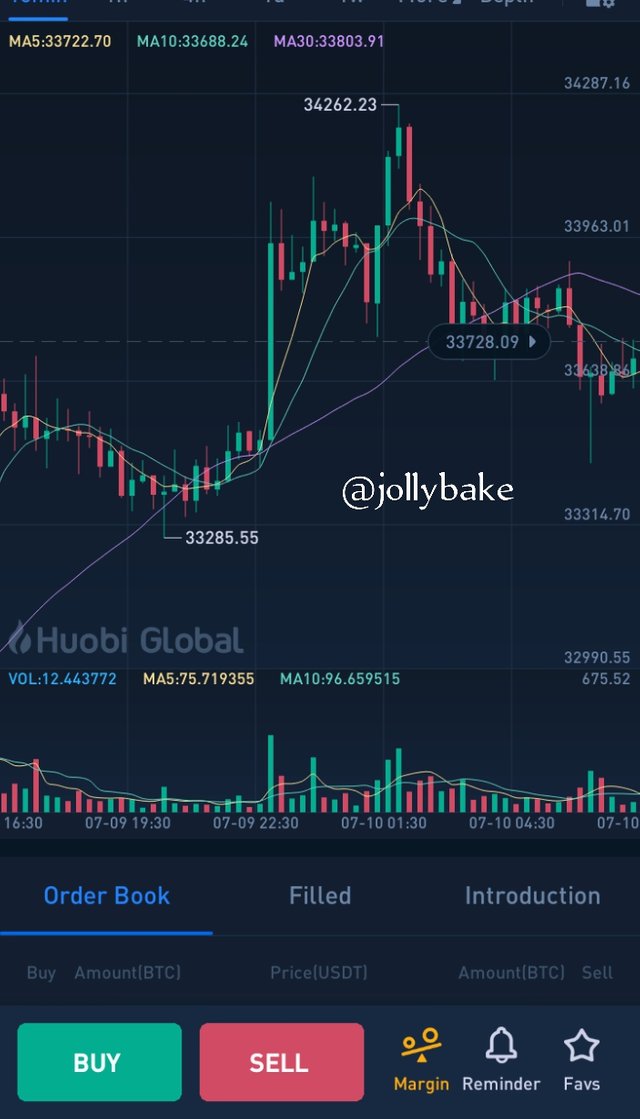
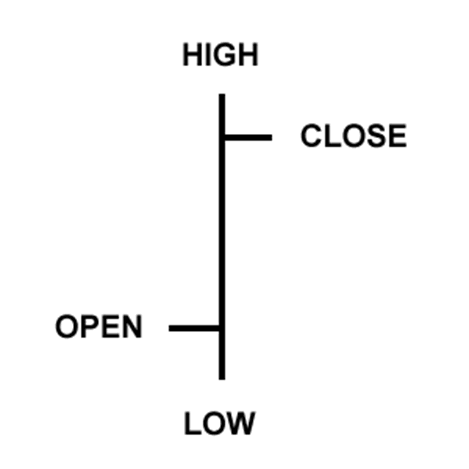
In Japanese candlestick, four movements illustrate the price for buying and selling and these are, OPEN, HIGH, CLOSE, and LOW.
The open is a part of the candlestick which explained the beginning of market price and its movement in the shadow or wick in an upward manner at a particular time frame say 1hour, 2 hours, or 1 day as the setting may be.
The high part of the candlestick shows the point where the market price has reached its highest at a particular time frame.
The close part of the candlestick indicates the end of the market price at a particular time frame. it shows the price recorded last in the candlestick.
The low is a part of the candlestick which explains the lowest market price at a particular point in time.
Describe any other two types of charts? (Screenshot required)
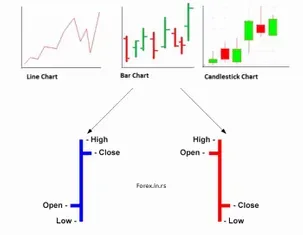

Line Chart
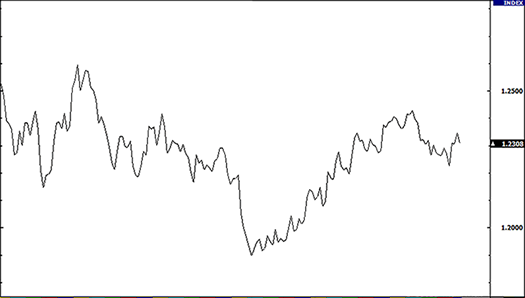
A line chart is a replica of quadratic equation graph where various price points are asterisks and join to together to give a continuous line.
It follows that, a line chart is a representation of one closing price to the next closing price.
It's easy to understand, but with line chart, the trader is not provided with information about the behaviour of price within the period or how it affects price in the future.

Even though the trader is not provided with information, it still help the trader see trends more easily and visually compare the closing price from one period to the next.
some traders ignores the open, high or low level and focuses only on closing because you sell what was previously bought or buy out what was previously sold at a new market price with the knowledge of the closing level.
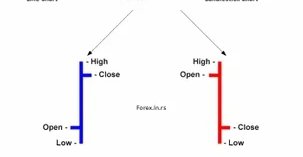
Bar Chart
The bar chart is the presentation of price on a bar which shows the high(top) and a low(bottom) with a line on either side of the bar; right side being the closing price and the left side being the opening price for a specific point in time.
On a bar chart, you can identify a bullish or bearish bar very quickly without relying on the colour, if the handle on the left is lower than the handle on the right, then it is a bullish bar but if the handle on the left is higher than the handle on the right it is a bearish bar.
In your own words, explain why the Japanese Candlestick chart is mostly used by traders.
In trading, no trader wants to encounter a loss in their business that is why I believe the traders of cryptocurrency go for Japanese candlestick because it supplies a more comprehensive and valid information about the movement of price giving out a visual presentation of supply and demand behind each time interval's price action.
Describe a bullish candle and a bearish candle identifying its anatomy? (Screenshot is required)
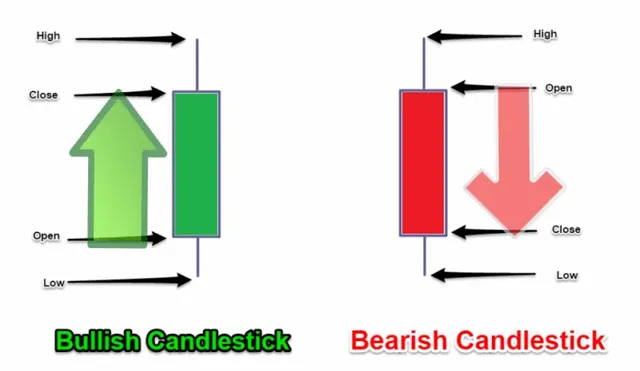
Bullish Candlestick
Every trader wants to know when there is an increase in the price of a cryptocurrency asset and that's why a bullish candlestick is required because it's tells exactly the increase in price which is characterized by closing price above the opening price showing an upward movement of price at a specific time
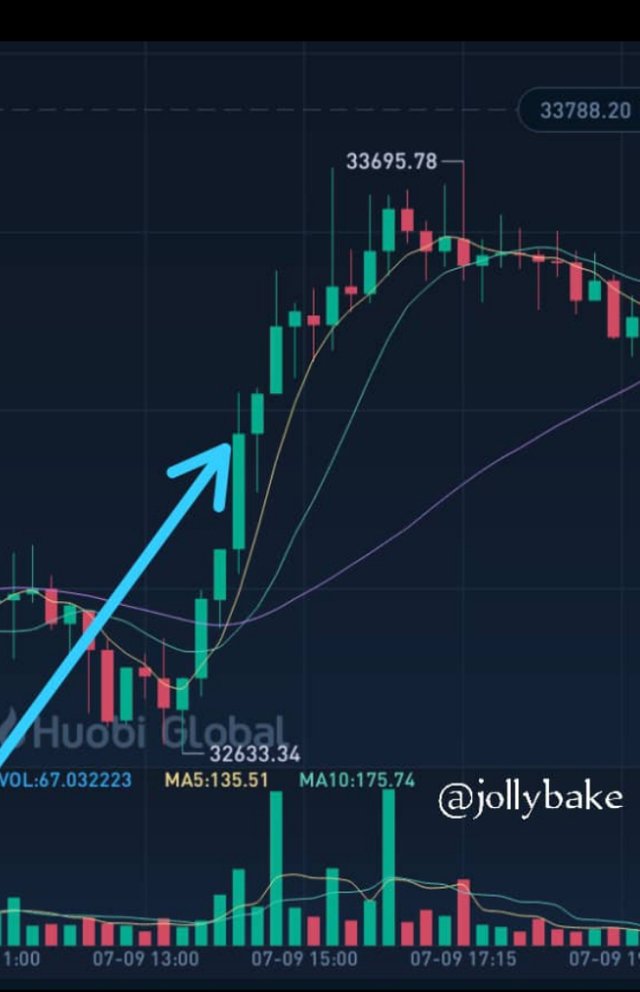
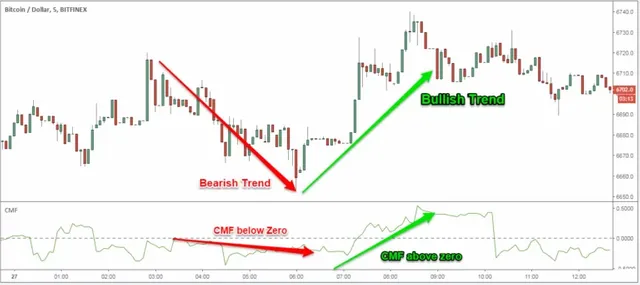
The image above with the arrow pointer, shows a sequence of bullish candlestick with an increase in price called Bullish Trend
The opening price of the bullish candle is below the close price of the bullish candle showing an increase in the price of the crypto asset. Also, the high of the session is above the low of the session over time.
By default, bullish candle is usually represented by green or white colour.
The open price shows the start of market price which increases until terminates at the close of the market price.
The thick green part of the candle is called the body. The vertical line that run through the candle showing the highest and lowest price of the candle is known as Shadow or Wick.
Bearish Candlestick
In contrast to the bullish candle, the bearish candle shows the decrease in price of an asset over a specific time.
The bearish candle indicates a decrease over time by the closing price settling and closing below the opening price.
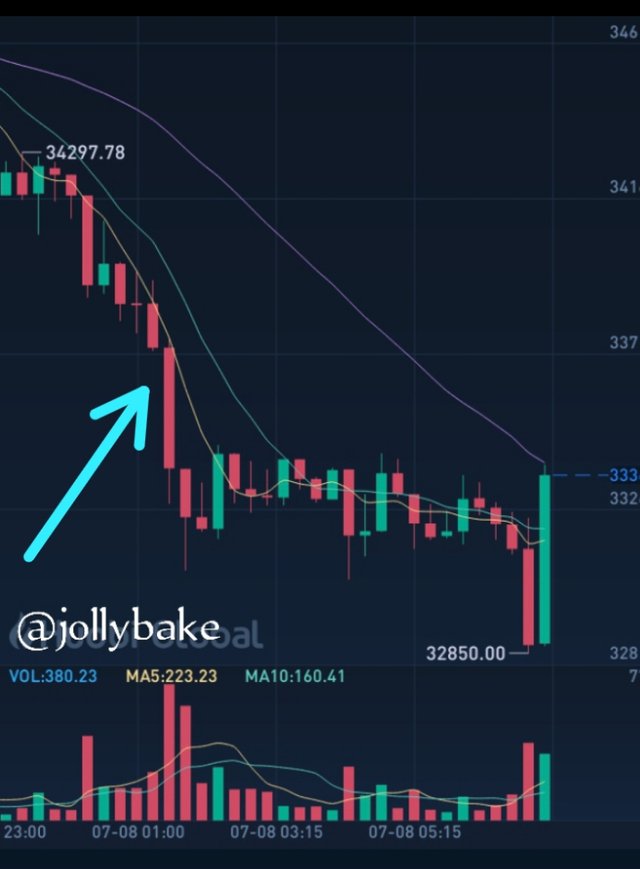
In the above image where an arrow is pointing shows Bearish trend.
By default, the colour of bearish candlestick is red or black.The filled red or black portion of the candlestick is known as the body.
The red vertical line that run through the body is also called shadow or wick which shows at the end of each vertical line, the highest or lowest price of the asset
Conclusions
The importance of charts to cryptocurrency trading cannot be overemphasized.
It is the bedrock of trading and for a trader to be successful in the buying and selling of assets, he/she must have an understanding about charts
Hello @jollybake, I’m glad you participated in the 2nd week of the Beginner’s class at the Steemit Crypto Academy. Your grades in this task are as follows:
Recommendation / Feedback:
I'm impressed with your submission. You did a great research on Japanese candlestick chart. Thank you for participating in this homework task.
Thanks alot professor @reminiscence01
For the remark. Correction taken
Hi professor @reminiscence01
My post is 5 days already but has not been voted according to the grading.
Please check and tell the appropriate quarters to do something.
Cc: @steemcurator02