Crypto Academy / Season 3 / Week 3- Homework Post for [@lenonmc21] All about Trends, Supports and Resistances and simple chart patterns by @joemuknic
Hello steemians welcome to my homework post which is about trends, support and obviously resistance which are simple chart patterns and this homework was given by our one and only professor @lenonmc21.


WHAT IS A "TREND" AND TREND LINES AND WHAT IS THEIR ROLE IN CHARTS?


This is the technical aspect when it comes to predicting the price action of an asset at a different time frame so we have the bullish trend and also bearish trend.
Bullish Trend
Bullish trend or buy trend refers to the run up of the price of an asset meaning the price of the asset continues to go up and create higher lows.
Bearish Trend
Bearish trend or sell trend refers to the run down of the price of an asset meaning it the price of the asset continues to go down and create lower highs.
There is also a moment in a trend when it is not going up or down but going sideways.
TREND LINES
This line is a line drawn on a pattern chart so as to know the direction of the pattern for that asset.
The lines can be drawn from left to right or from right to left depending on the trend.
THE ROLES OF TREND LINES IN CHARTS
It is a popular line used to confirm the movement of the trend either in a uptrend or downtrend so that you are successful in your trades so that you maximize your wins and you manage your loses.
.png)
HOW TO DRAW AN UPTREND LINE AND DOWNTREND LINE(SHOW A SCREENSHOT OF EACH)

THE UPTREND
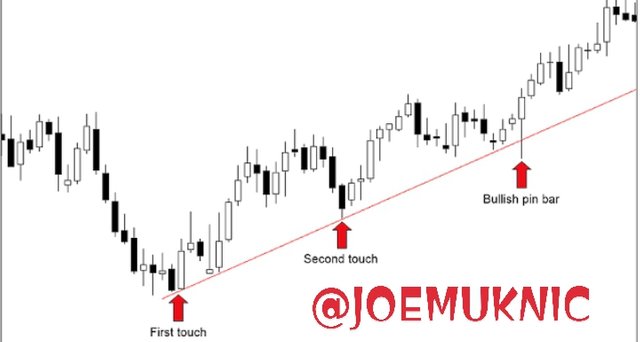
To draw the uptrend line it is drawn from bottom to top, because the trend line will be showing a bullish move and the trend is creating a higher low meaning the price is increasing.

DOWNTREND LINE
To draw the downtrend line it is drawn from the up to down creating lower lows which means the price of that asset is going down .
_1626627662123.jpeg)
.png)
WHAT "SUPPORTS AND RESISTANCE ARE AND HOW WE CAN IDENTIFY BOTH (SHOW A SCREENSHOT OF EACH ONE)
.png)
I will be explaining the difference between support and resistance.
SUPPORT
This level called support level shows the level where a buy other can be entered, you notice it when a downward trend is paused for a while but if it breaks it then it is going down.
- the uptrend can continue if the supports holds for a particular period of time
_1626628276045.jpeg)
THE RESISTANCE
This level is the level that shows, the level where a sell trade should be entered or take profits if you are already in a long.
- if the pattern goes above the resistance line then should expect the price of that asset should skyrocket.
- if the price start to fall from the resistance point then the resistance point is too strong so you should take profit.
_1626628828987.png)
- manage your trend lines so that you will not get confused.
- you have to be patient so that you don't get rekt.
.png)
IN YOUR OWN WORDS AT LEAST 2 SIMPLE CHART PATTERNS WITH (SCREENSHOTS)
.png)
DOUBLE BOTTOM
The double button is same thing as retest and reversal means the price will go bullsih if it works out, the pattern looks like a W but it depends on the time frame you are looking at it and also it predicts the distance of the bullish trend.
DIAMOND PATTERN

_1626629828263.png)
Technical analysis is good tool to be used as a trader to predict the price of an asset so as to know the direction of the price of the asset so that you can maximize your earnings and also manage your losses
Finally I want thank professor @lenonmc21 for the good lecture that has been given to us so as to give us knowledge too so thank you.
.png)

_1626629592183.png)
This post was resteemed by @steemvote and received a 3.5% Upvote. Send 0.5 SBD or STEEM to @steemvote