Technical Indicators 2 - Crypto Academy / S4W4- Homework Post for @reminiscence01
INTRODUCTION
Hello Steemians, am @joelmaxwell and am very happy to be part of this great lecture by prof @reminiscence01 which is all about technical Indicators (2) which is advance of the first part.

Question 1(a)
Explain Leading and Lagging indicators in detail. Also, give examples of each of them.
Leading indicators
This is the type of indicator that aid traders to be able to predict the future price of assets, it also an indicator that give the trader idea or signal about when an assets, price will start movement and is of great advantage to the trader or investors because with the signal the will quickly enter the market and fulfill their aim of profit maximization.
It is an indicator that help in identification of when there is an overbought or oversold in the market which will also help the trader in knowing when to enter and exist the market in order to minimize lost.
Despite the fact, that leading indicators plays a role in all this advantages to trader it can also make the trader loss alot of funds due to the fact that it give false signals, fakeout and false reversal which may allow to trader quickly enter the market and lose alot of funds that is why from previous lecture we are always advice that using more than one indicator is risky but using other to confirm the signal is better.
Examples of leading indicator
- Relative strength index(RSI)
- stochastic Oscillation
- Rate of change
Lagging indicators
This is the type of indicator that helps the trader in identifying how the trend are moving in the market. It is also use in confirming the proce action after ot occur.
This type of indicators help to know if the price is actually moving in an uptrend movement or downtrend movement and are mostly prefered by traders for long term trading.
Examples of lagging indicators
- moving average
- Bollinger band
- parabolic SAR
Question 1(b)
With relevant screenshots from your chart, give a technical explanation of the market reaction on any of the examples given in question 1a. Do this for both leading and lagging indicators
For leading indicators
I will be using BTCUSD and stochastic oscillator
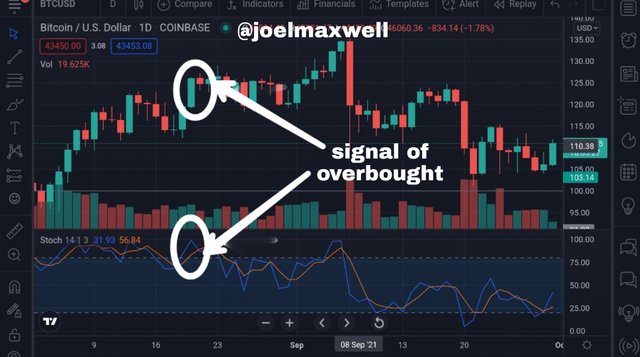
The overbought here shows us signal when the traders are satisfied with the asset the have bought in the market and after that the price falls meaning if a smart trader should see that he should capitalize on it and maximize profit.
Though lagging has great benefit but it also has a disadvantage which os that it appears late and by the the trader will be late to start trading and possibly may not meet up or will gain less profit.
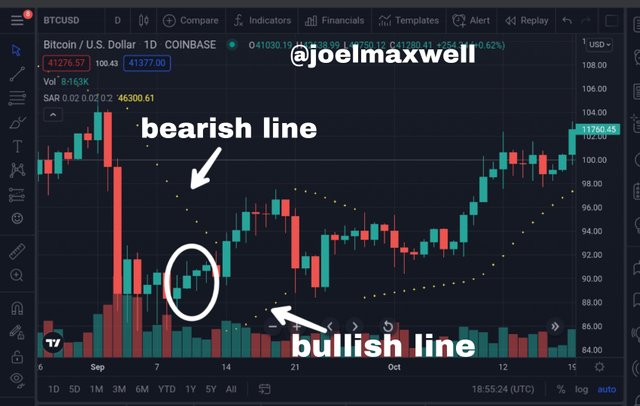
Example for lagging indicator
From the screenshot below, you will see the lagging indicator play it role from where I cycle.
The indicator used shown here started late when the price has already gone far.
That is why you will observe the bullish line started moving moving in an uptrend direction that when the bearish line form it started covering the cycle candlestick.
This is one of the disadvantages of the lagging indicators it appears late making the trader make low profits.
I will be using BTCUSD and parabolic sar
Question 2(a)
What are the factors to consider when using an indicator?
Before a trader consider using an indicator the following must be taken note of ;
Have knowledge about the indicator he want to use and also remember that it is not advisable to use one indicator but also add another to confirm the signal that he may jave seem from the previous indicator to avoid lossing asset.
Having knowledge is one then knowing how to configure the indicator and set it properly to enable him get the appropriate results.
The trader must also have idea about how the market trend is by this he must know the trend movement if the trend is an uptrend or downtrend
He must also know how the market is, should not just rush into the market but should have idea about how the market price is and the previous market prices.
The trader must also hav knowledge about confluence which is combination of 2 or more indicators to confirm signal in spotted from the previous one he was using.
Question 2(b)
Explain confluence in cryptocurrency trading.
Confluence in cryptocurrency trading has to do with when a trader makes use of 2 or more types of indicators in a chart to confirm the signal he has from the first one he was using previously. For example using EMA and stochastic oscillator to confirm the signal he may have gotten from let say Parabolic sar
It is also a situation whereby there are so many indicators in a chart giving a trader idea on what decision to take.
Question 2(c)
Pick a cryptocurrency pair of your choice and analyze the crypto pair using a confluence of any technical indicator and other technical analysis tools. (Screenshot of your chart is required ).
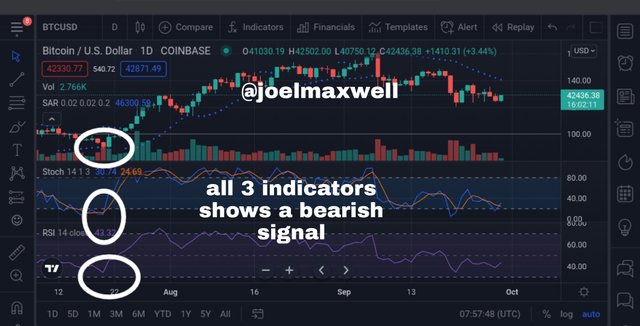
Here I wll be using BTCUSD as the cryptocurrency and parabolic sar, stochastic oscillator and relative strength index to show how to spot a bearish signal.
I was at first using parabolic sar but I will add the other two indicators to confirm and know the appropriate decision in which I have to make
Screenshot below
[Screenshot from coinmarket]
Question 3(a)
Explain how you can filter false signals from an indicator.
Filtering fake signals from an indicator is one thing and very important thing for a trader to avoid because seeing a fake signal and rushing into the market can possibly land the trader with an unforeseen circumstances because he may invest alot not knowing how the market price will react to the signal that is why it is advisable to use one or more trading indicator to avoid all this.
One must be very sure about the signal that he or she sees or predict and to he very sure he must make use of more indicators to test it over and over, imagine a trader seeing an uptrend and rushing into the market then the market price react he the opposite way(downtrend) this will automatically weaken the trader because he might have invested alot in the market due to false signal.
The way to avoid all this is confluence has explained earlier, as a trader using one indicator is not advisable. So must must make use of more indicators and this will help you in spotting the appropriate signal and by this maximize profit and also minimize losses.
Question 3(b)
b) Explain your understanding of divergences and how they can help in making a good trading decision.
Divergence is the situation whereby the market price is not moving in the same direction as the indicator signal it, by this I mean the market price is going inverse direction to the indicator signal. It is very essential and important when it comes to trading because of the roles it plays such as detecting the very early the reversal that will be occuring in assets price and using it in filtering of false signals.
The help in making good decisions when it comes to trading lets take for example a trader spotted the price of an assets going high and signal is moving different he or she wil have knowledge that it is appropriate for him to leave the market immediately in order to minimize loss and inverse occur if he want to maximize profit.
Question 3(c)
Using relevant screenshots and an indicator of your choice, explain bullish and bearish divergences on any cryptocurrency pair.
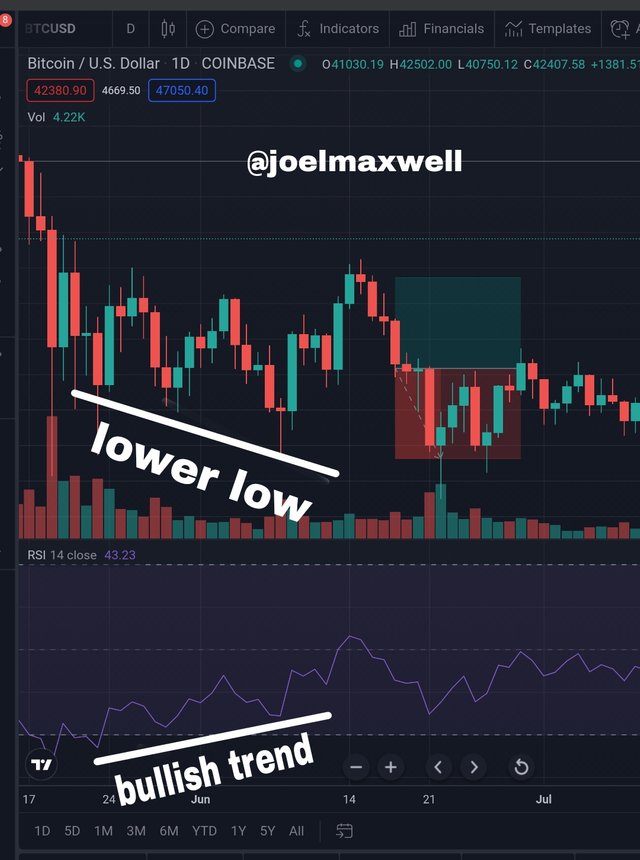
Bullish divergence
This is the type of divergence in which the asset price is forming a lower low while the indicator that will be use is signaling an uptrend direction while making a formation of higher low.
Screenshot below
I will be using BTCUSD and RSI as indicator
[Screenshot from tradingview]
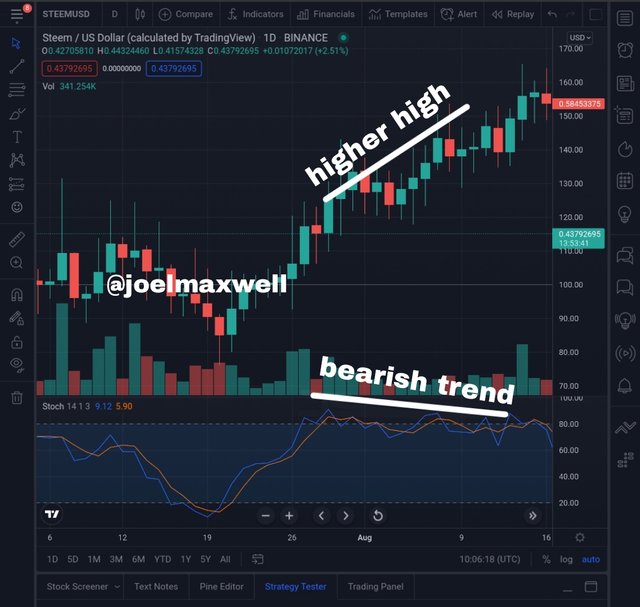
Bearish divergence
This is the type of divergence in which the asset price is forming a higher high while the indicator that will be use is signaling an downtrend direction while making a formation of lower low.
Screenshot below
Using STEEMUSD and using stochastic oscillator indicator.
[Screenshot from tradingview]
CONCLUSION
The lecture is really an interesting one I have learn alot of thing like we were taught about the leading indicator which has to do with signaling the trader about price movement and lagging which has to do with letting traders know about trend movement.
We were also educate on confluence which is all about combining many indicators to confirm signal spotted by one. Filtering of false signal and divergence were also part of the wonderful lecture.
I want to thank prof @reminiscence01 for the wonderful lecture and I hope I have improved
Hello @joelmaxwell, I’m glad you participated in the 4th week Season 4 of the Beginner’s class at the Steemit Crypto Academy. Your grades in this task are as follows:
Observations:
This is not true. Confluence have to do with obtaining the same trading signal from different technical analysis tools to increase the strength of the signal.
Recommendation / Feedback:
Thank you for submitting your homework task.
Thank you @prof and God bless you