Crypto Academy Season 2 - Week 12 - For @kouba01
RSI INDICATOR
The RSI , acronym for Relative Strength Index (Indicator of Relative Strength) is a technical indicator used in the analysis of financial markets. The task of this technical indicator is to represent the strength (or the weakness) of a stock or even of any market.
The RSI is classified as an oscillator, which measures the speed and direction of price movements .
The RSI calculates momentum as the ratio between "high" and "low" closes. This therefore means that stocks (or other markets) that have had more positive changes have a higher RSI than stocks that have more or stronger negative changes.
The RSI is typically used on biweekly charts, where strength is measured on a scale ranging from 0 to 100, with highs and lows found in a range of 70 and 30 respectively.
The shorter or longer timeframes are as always used for or shorter, or longer forecasts. Obviously, when you start to go into territories even higher than 80, or lower than 20, it means that the momentum, or the market impulse, is much more energetic.
The RSI is formed by a graph that is found in most cases under the main price chart (then it depends on where you put it). The indicator has an upper line at the 70 level, and a lower line at 30. The middle bar is at 50. The inventor of the RSI, Welles Wilder, recommends using the RSI with the last 14 periods.
The level of the RSI therefore measures the recent strength of the market . The momentum (Momentum) of the RSI is therefore directly proportional to the speed of the trend change.
IS THE RSI TO BE TRUSTED?
The RSI can be trusted as it makes it possible for its users to be able to know when to buy and when to sell, using the RSI it is possible for the users to get a good trading entry, this makes the understanding of RSI an important asset for trading the volatile market of cryptocurrency.
HOW TO SET UP THE RSI CHART
We will be exploring next on how the RSI can be set up and configured using our smart phones.
To set up and configure the RSI, the first step is to download the app from the play store (N.B: for this demo we will be making use of the trading app)
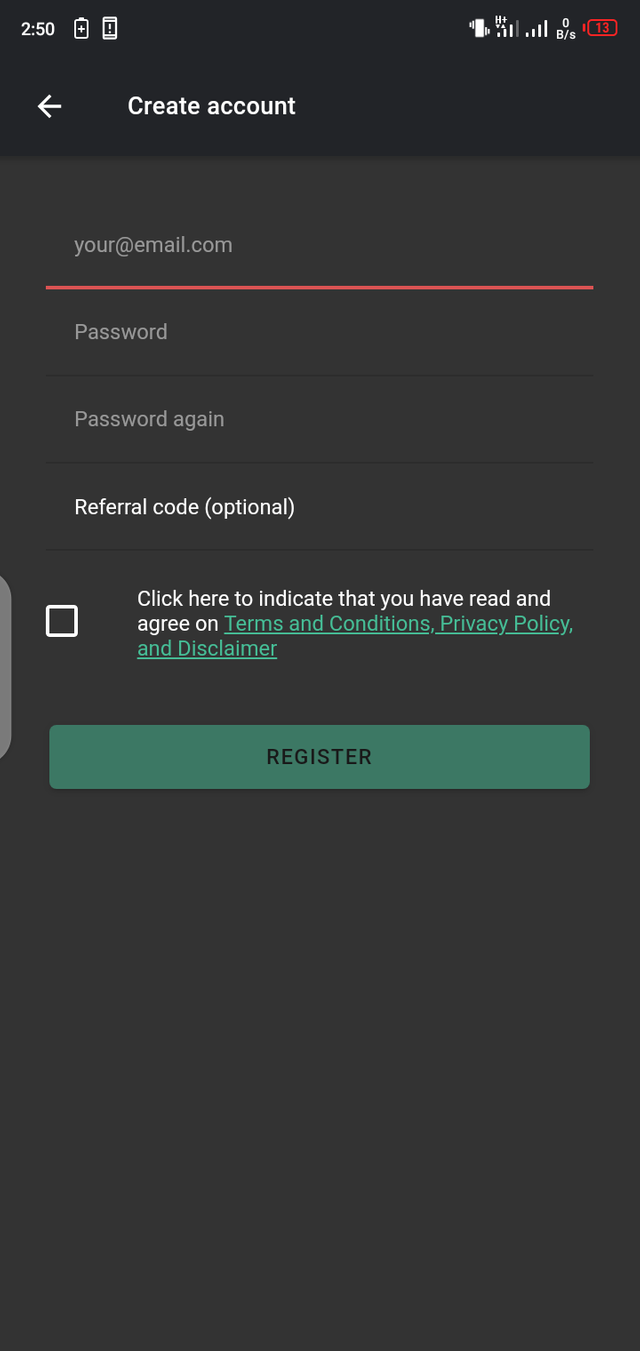
Secondly, you login with your registered email or if you haven't used tradiny before you can sign up to create a new account.
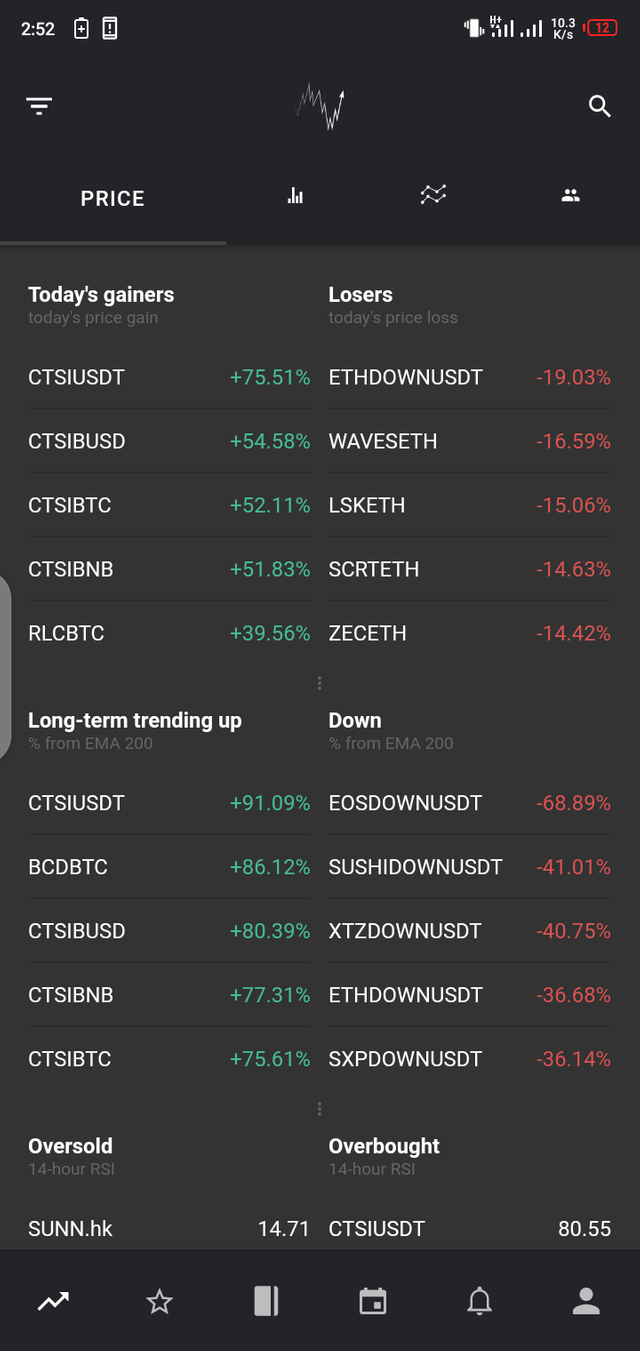
Next you select the chart symbol at the top of your screen. That is the symbol after price
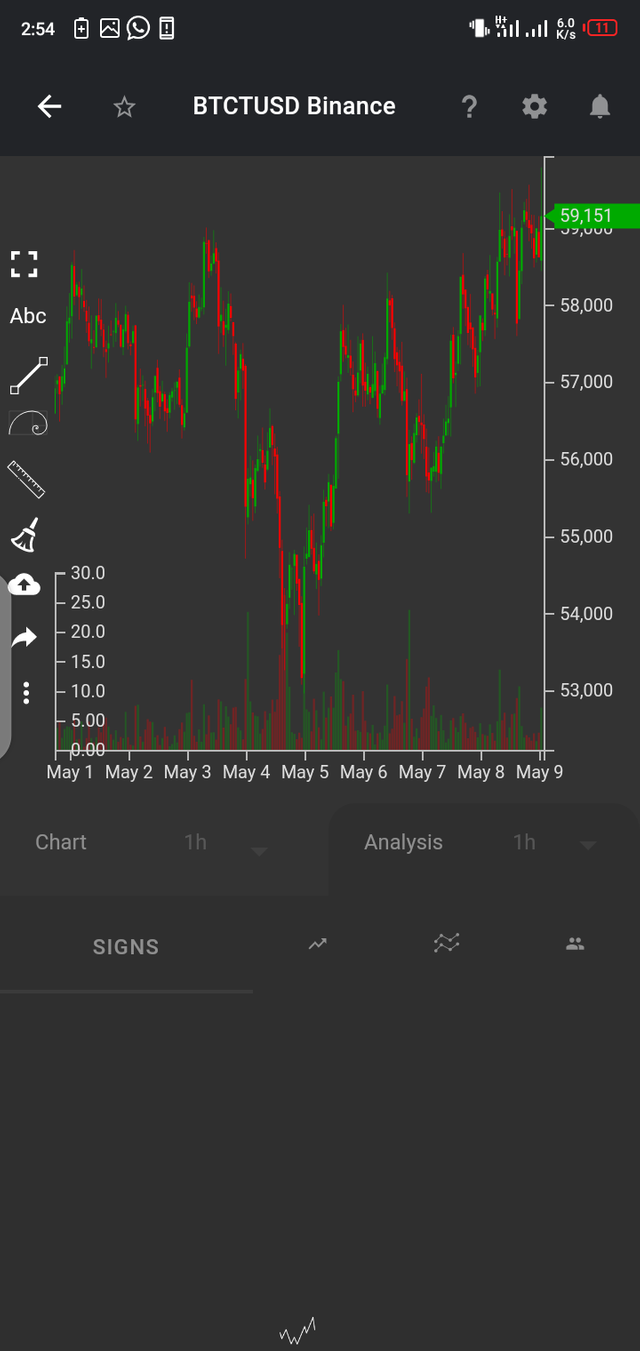
Once the chart is displayed, at the bottom of the screen you will see 'signs' click on it
WHY IS THE RSI 14 BY DEFAULT
The default RSI setting uses 14 periods, which means that the indicator takes into consideration the last 14 candles.
It compares the average gain and average loss, analyzes how many of the last 14 candles have been bullish and how many bearish, and also evaluates the size of the candle.
For example, if all 14 past candles were clearly bullish, the RSI would show a value of 100. If the last 14 candles were all clearly bearish, the RSI would show a value of 0. You often don't even need the RSI if you take the time to look closely at the last 14 candles. However, the indicator is a good tool for reducing analysis times and obtaining objective confirmation.
OVERBOUGHT AND OVERSOLD IN THE RSI
OVERSOLD:
When an RSI value is between 0 and 30 it is said to be oversold. Some traders assume that an oversold currency pair indicates that the market's downtrend reverses, hence a buying opportunity (i.e. a bullish signal).
OVERBOUGHT:
On the other hand, an RSI value that falls in the 70-100 region of the scale is considered overbought. This signal suggests that the resistance level for the currency pair is near or has been reached and the rate is likely to drop. Some traders will see this as an opportunity for sell i.e. a bearish signal.

FALSE SIGNALS IN ONLINE TRADING
The concept of Technical Analysis serve to provide and understand as much information as possible on the past movement of the price in order to be able to predict its future trend.
Studying a chart looking for various price patterns may seem like a rather complex activity, but really the difficult part is distinguishing the true entry signals from the false ones that lead us to enter the market when the probabilities are not really on our side even if they seem to be.
The false signals in trading occur mainly in markets with high volatility or in the vicinity of important macroeconomic news. These particular moments of the market can momentarily break some supports or resistances or even reverse the trend of a market for a short period, creating a real moment of panic among the active subjects of the market.
I remind you when you start your trading day you should always check the volatility statistics and economic calendar to see if there is any upcoming news.
SPOTING FALSE SIGNALS
There are numerous mediums to identify potential false signals in trading but the main tools used by professional traders are the Volume analysis and the use of at least two indicators of the same parameter.
Analyzing the volume allows us to understand what are the trading volumes carried out in a given trading session; when we are faced with strong trading volumes we usually also have strong price movements , when instead the movements are not supported by strong capital, price movements tend to decrease.
It is therefore important to always try to identify if there are divergences between volumes and price movements.
CHART REVIEW
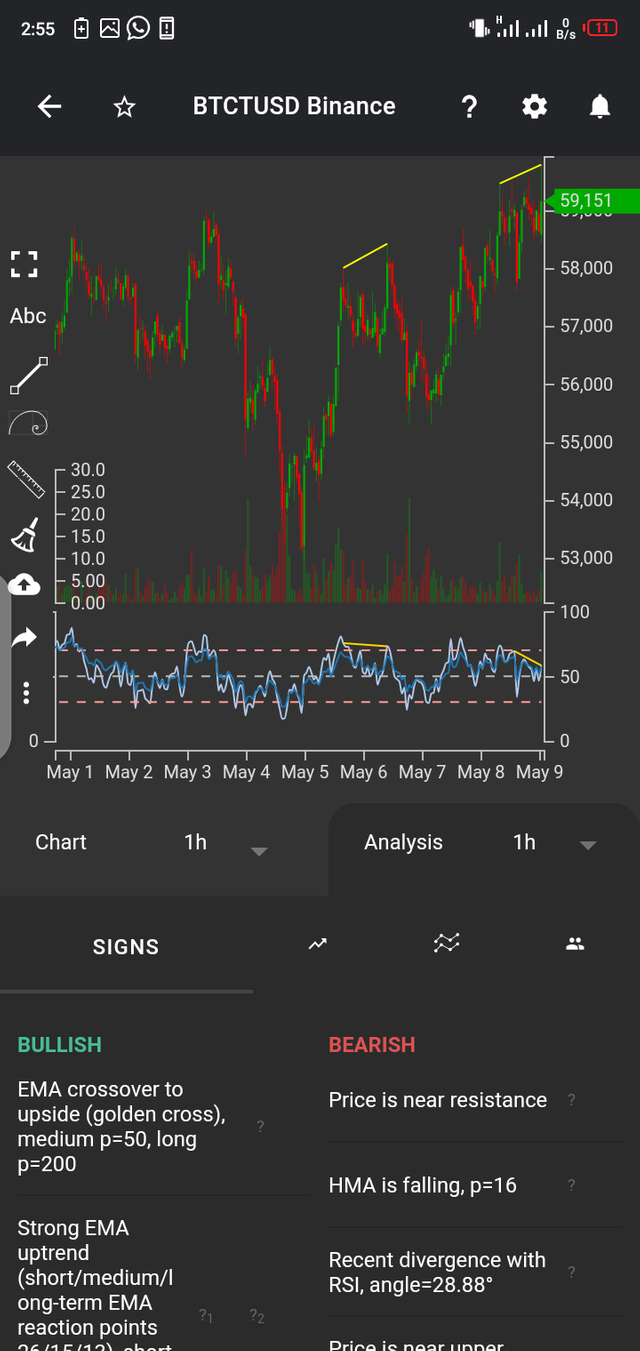
Considering the chart above, the circled part at the top of the chart indicates that it is overbought, so you can sell and the lower circles part indicates oversold, so it is advisable to sell.
Unfortunately @jessica999, this week's submission time has expired.