SuperTrend Indicator - Crypto Academy /S5W7-Homework Post for kouba01

Q.1. Show your understanding of the SuperTrend as a trading indicator and how it is calculated?

Sometimes, the market trades within a range or trades sideways. Then, we usually lookout for support and resistance to enable us make profit from the price movement. However, when the market begins to trend we'll need to up our ante. If we consider a bearish market as an example, it is not advisable to enter the market when it has begun to trend or it has begun a dip (ie. bearish dip).
Notwithstanding, with an indicator like SuperTrend, we get a valuable guide as investors under trending market conditions. As it is named, this is a super indicator that is specifically applicable for trending markets.
This indicator shows a trend when it occurs in a market. It also serves as support and resistance depending on the market trend. In an uptrend, the indicator is usually below the price, acting as support and colored green, while in a downtrend, it is above the price acting as resistance and colored red. The line above or below is referred to as over trend.
When the overtrend touches the price and seems to cross over to the opposite side, this indicates a trend reversal. This indicator also plots horizontally.
As per direction of price, three possible directions can be deduced from the SuperTrend indicator. They are: bullish direction, flat direction, and bearish direction.
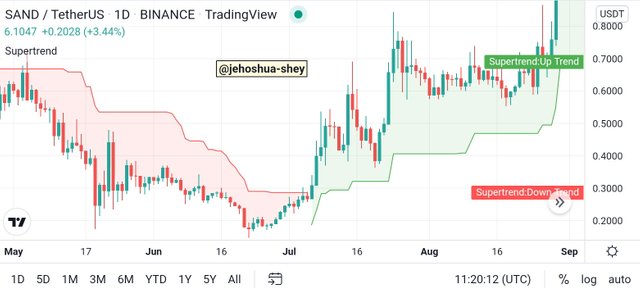
SuperTrend indicator showing flat, up and down trends
HOW IS IT CALCULATED?
To calculate the SuperTrend, we'll need to define our factor and our period. The period will be used to deduce the ATR which will be combined with the factor and the high and low prices to give the SuperTrend indicator value.
The formula for calculating the SuperTrend is given below
Uptrend = (Higher + Lower) / 2 + factor x ATR (period)
Downtrend = (Higher + Lower) / 2 - factor x ATR (period)
Basically, the highest and lowest price is averaged and then a multiple comprising of the factor and ATR is either added to the average (uptrend) or subtracted from the average (downtrend).
To deduce the ATR as was said earlier, we would require a period value. ATR is simply the average true range and has to be deduced for a given number of periods.
Here's how each ATR value is calculated
First, we compare the last candle's closing price with the current candle's top and bottom price, and then take the highest distance between. This greatest distance is known as the actual or true range.
Next, we obtain this value for as many candles according to the number of periods and find the average, i.e. if it's 14 periods, we find the true range for 14 candles, sum them up, then divide by 14 to get the average true range.
Once ATR is ready, we need to define our factor. The product of our factor and the current ATR is very important in calculating the SuperTrend indicator. Once we have it, we then get the average of the high and low prices of the current candle. After this, out next action depends on the trend.
If it's a downtrend, then we'll minus the product from the average. If it's an uptrend, then we'll add the product to the average.
NB: Every value calculated is compared with the price trend. If it does not agree, then th calculated value is dropped and the incumbent one remains. Thus, the indicator never goes against the trend.

Q.2. What are the main parameters of the Supertrend indicator and How to configure them and is it advisable to change its default settings? (Screenshot required)

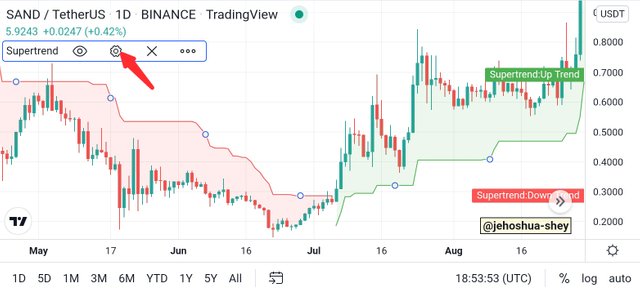
The main parameter of this indicator is the factor and the ATR length or period. To configure this indicator, simply add it to the chart, then click on the title and then the settings icon.
On the inputs tab, you find these two parameters which have been stated as most important.
Screenshot taken from Tradingview mobile app
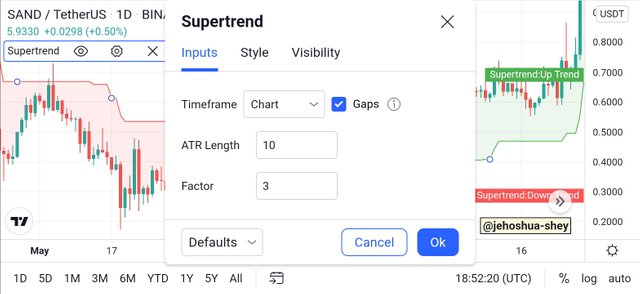
Screenshot taken from Tradingview mobile app
From input tab, we can then adjust the settings if we need to or want to.
IS IT ADVISABLE TO CHANGE THE SETTINGS
As a general rule of thumb, back test your choices to get the best. Using a factor of 3 (default) may return excessive exit signals while a factor or 4 or 5 may be more palatable. It depends on the trader generally, and their trading style.
However, whichever way, the rule of thumb still holds which is, back test choices to uncover the most reliable for a particular trading style.

Q.3. Based on the use of the SuperTend indicator, how can one predict whether the trend will be bullish or bearish (Screenshot required)

Like was stated earlier, the SuperTrend indicator is especially proficient in catching trends whether it's bullish or bearish. It's only flaw is it's lapses in a ranging market. However, for a trending market, it can be used to predict and ride trends.
This is how it is used to predict trends:
BULLISH OR UPTREND
For a bullish trend, there's the end of a bearish trend and the start of a green zone. The price is above the indicator and the direction of both the price and the SuperTrend indicator is upwards. The tip of the indicator line should also be a good distance away from the price.
In a bullish trend, only bullish market entries are advised.
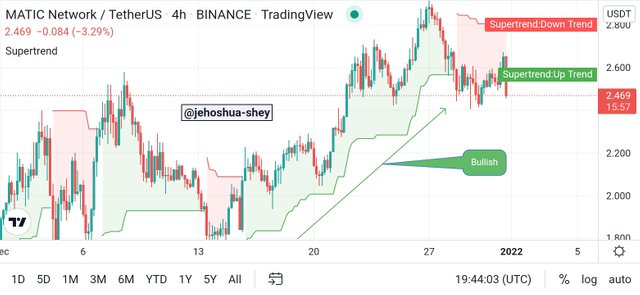
Screenshot taken from Tradingview mobile app
BEARISH OR DOWNTREND
For a bearish trend, there's the end of a bullish trend and the start of a red zone. The price is below the indicator and the direction of both the price and the SuperTrend indicator is downwards. The tip of the indicator line should also be a good distance away from the price.
In a bearish trend, only bearish market entries are advised.
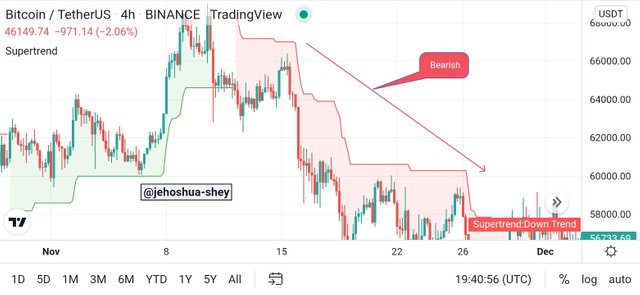
Screenshot taken from Tradingview mobile app

Q.4. Explain how the Supertrend indicator is also used to understand sell / buy signals, by analyzing its different movements.(screenshot required)

Asides from trends, the SuperTrend indicator can also tell entry and exit points. It can be used to determine the optimal entry point during a trend and also a profitable and risk averse exit point.
To use the SuperTrend indicator, you'll need to look out for areas where the price moves in an opposite to the SuperTrend indicator. This is a sign of trend reversal as can be used to deduce buy and sell signals.
UPTREND
If the price is moving in a downtrend or downwards and the SuperTrend indicator begins to move upwards, then we can anticipate an uptrend reversal and thus make a buy entry when the SuperTrend begins to go in the or shows a downward direction.
For exits, we wait for a reversal. When the indicator turns downward from the uptrend, we can make our buy exit.
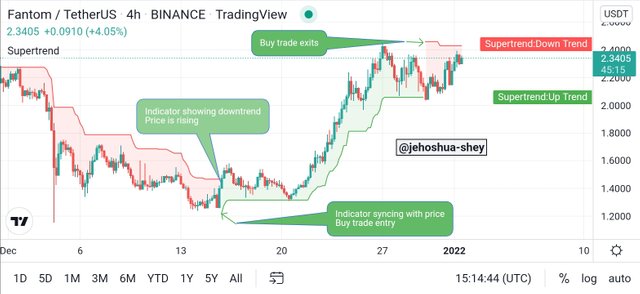
Screenshot taken from Tradingview mobile app
DOWNTREND
If the price is moving in an uptrend or upwards and the SuperTrend indicator begins to move downwards, then we can anticipate a downtrend reversal and thus make a sell entry when the SuperTrend begins to go in the or shows an upward direction.
For exits, we wait for a reversal. When the indicator turns downward from the uptrend, we can make our buy exit.
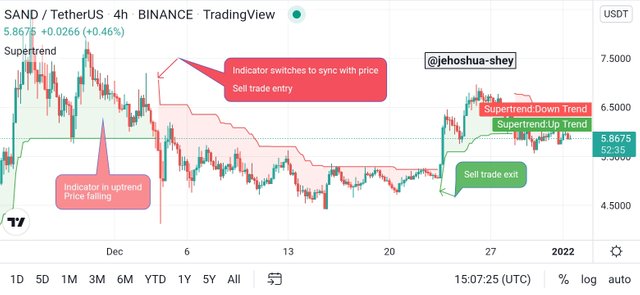
Screenshot taken from Tradingview mobile app

Q.5. How can we determine breakout points using Supertrend and Donchian Channel indicators? Explain this based on a clear examples. (Screenshot required))

Asides from filtering and identifying trends, the SuperTrend indicator can also do something else though it has to be supported with another indicator. Together with an indicator called Donchian channels, the super trend can be used to spot determine breakouts.
The Donchian channels is an indicator the plots a cloud bounded by the price highest and price lows of a given period. At inception, this indicator would consider up to 4 weeks, but currently, traders are allowed to be creative when using the indicator. Thus, they can change the period to something more suitable.
When using the Donchian channels, the more the period, it seems the better the results however, the rule of thumb still remains back testing.
In combination with the super trend indicator, these two can legit spot breakouts either in the upward or downward direction. And the strategy employed is far from difficult. Here is the simple strategy for spotting breakouts with a combination of SuperTrend and Donchian channels indicators
UPTREND BREAKOUTS
For uptrend breakouts, we need to clearly identify an uptrend using the SuperTrend indicator. The indicator should be green and upwards. The price also should be headed in the upward direction.
To spot a breakout then, we simply look out for where 2 consecutive candles crosses above the Donchian channels. This signifies an uptrend breakout. Only long positions are advised.
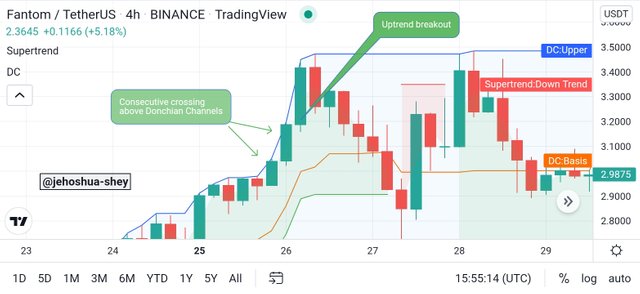
Screenshot taken from Tradingview mobile app
DOWNTREND BREAKOUTS
For downtrend breakouts, we need to clearly identify a downtrend using the SuperTrend indicator. The indicator should be red and downwards. The price also should be headed in the downward direction.
To spot a breakout then, we simply look out for where 2 consecutive candles crosses below the Donchian channels. This signifies a downtrend breakout. Only short positions are advised.
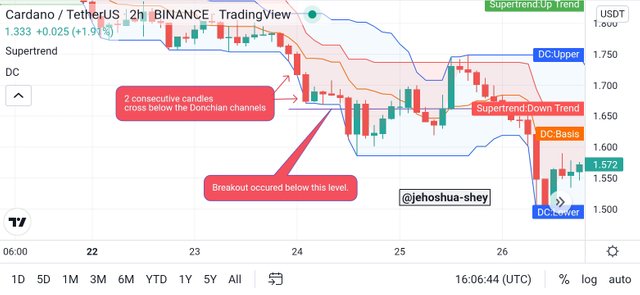

Q.6. Do you see the effectiveness of combining two SuperTrend indicators (fast and slow) in crypto trading? Explain this based on a clear example. (Screenshot required))

Combining indicators has always been a good practice just like we were able to identify breakouts with Donchian Channels and SuperTrend indicators. Whenever indicators are combined, they can be used to confirm signals.
However, this is not about combining two indicators bit about combining two SuperTrend indicators. One will be faster and the other slower. Since they are the same indicator with different speeds, when they eventually align, as very strong trading signal is produced.
Consider the example of the use of double SuperTrend indicators i.e. 21-2 and 10-3, in the FTMUSDT 4H chart below
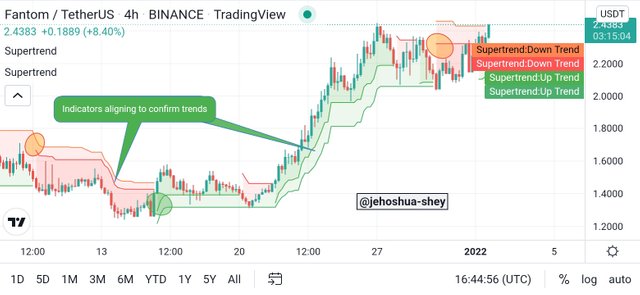
Screenshot taken from Tradingview mobile app
From the chart in the image above, we see that in a trending market, the two SuperTrend indicators can align to confirm the trend signal whether bearish or bullish.
Also, the points where they aligns serves as action points. For a bearish trend, the point where the slower SuperTrend indicator aligns with the faster SuperTrend indicator, we have a sell entry or buy exit point. This is circled red in the chart.
For a bullish trend, the point where the slower SuperTrend indicator aligns with the faster SuperTrend indicator, we have a buy entry or sell exit point. This is circled green in the chart.

Q.7. Is there a need to pair another indicator to make this indicator work better as a filter and help get rid of false signals? Use a graphic to support your answer. (screenshot required)

When we're not using double SuperTrend indicators, we can combine one SuperTrend indicator with a different indicator to also get signal confirmation. Interestingly, I'm not saying one shouldn't combine two SuperTrend indicators with a different indicator making it three in all.
However, using two different indicators like was stated earlier is potent enough for signal confirmations. And for the SuperTrend indicator, one indicator that will combine beautifully to confirm signals is the parabolic SAR.
The parabolic SAR is sort of similar to SuperTrend indicator but it has no green and red zones or clouds. It however does the above and below price plots. When it's above the price it's bearish while the reverse is true for when the parabolic SAR is below the price.
Consider the instance of combining the parabolic SAR and the SuperTrend indicator below
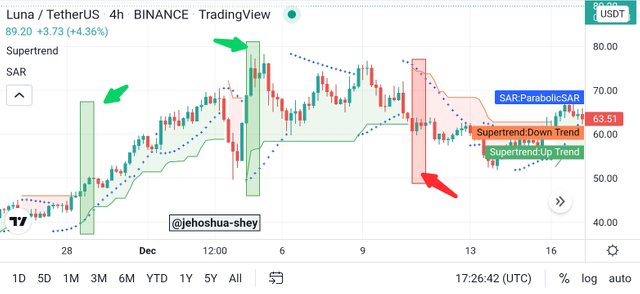
Screenshot taken from Tradingview mobile app
The chart above is a LUNAUSDT 4Hchart. In it, we can see 3 vertical rectangles. The first 2 rectangles are green and the last is red (from L-R).
The green rectangle show some points where the SuperTrend indicator turns green and the parabolic SAR is below the price as well. The red rectangle shows a point where the SuperTrend indicator turns red while the parabolic SAR is above the price.
Observe that at these points, the signal produc is very concrete. This is because two different powerfully indicators are agreeing on one thing.
Using this strategy, you enter long positions at any of the green rectangles or points where both indicators are bullish and exit where either one or both indicators turn bearish. You can enter short positions at the red rectangle or points where both indicators are bearish and exit where either one or both indicators turn bullish.

Q.8. List the advantages and disadvantages of the Supertrend indicator:

Using the SuperTrend indicator comes with advantages and disadvantages. It is very import to not omit them when talking about the indicator.
ADVANTAGES
SuperTrend indicator can enable the trader to identify trends especially when it is strong.
SuperTrend indicator comes in handy for long term trades. It helps the trader clearly see the price direction in the long term.
DISADVANTAGES
SuperTrend indicator is not suitable for ranging markets. It offers little or nothing in the area of guidance when the market is ranging. The trader had better looked elsewhere.
SuperTrend indicator is not suitable not be used alone. It is better to be used in combination with other indicators for confirmation. It can be doubled though.

CONCLUSION

The SuperTrend indicator is a very potent indicator especially when it comes to updating the trader on the current trend of the market. It is very useful for spotting strong trends especially when it is combined with another potent indicator.
The indicator can also give signals and confirmation if it is doubled on the chart with different settings (i.e. 10-3 and 21-2). This indicator however shows weakness when it is applied in a ranging market. The indicator is also suitable for long term trades, though it can be used for short term trade if it is combined with a suitable indicator.
Thanks for reading.
Cc:
@kouba01
This post has been rewarded by @bright-obias from @steemcurator04 Account with support from the Steem Community Curation Project."
Keep posting good content and keep following @steemitblog for more updates. Thank you.