Highly Profitable Trading Strategy with VuManChu Cipher B -Steemit Crypto Academy | S5W6 | Homework Post for @reddileep

Q.1. Define VuManChu Cipher B Indicator in your own words.

The VuManChu Cipher B indicator is a very potent indicate that is made up of numerous major indicators. It falls under the category of indicators plotted on a separate scale below the candlestick chart and thus, is comprised of other major indicators of the same category.
When viewed with night mode turned on on the chart, this indicators appears like a wave-like rainbow owing to the different component indicators being assigned different colors. These component indicators include RSI, Money Flow, Money Volume and Market Momentum.
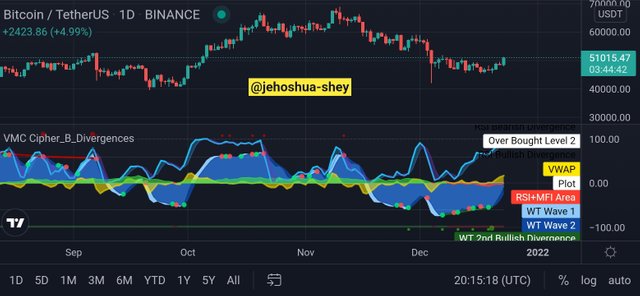 Screenshot taken from Tradingview mobile app
This indicator helps solve the problem of limited use of indicators on the free packages of most trading chart platforms as it combines numerous indicators into one and allows us to use as many of the component indicators as we want.
It can be found on the Tradingview platform among the community scripts and it bears a striking resemblance to the Market Cipher Indicator - a tool only available to paid users of the platform. This indicator is very useful for analyzing charts across different time frames.

Q.2. How to customize the VuManChu Cipher B Indicator according to our requirements? (Screenshots required)

It has earlier been stated that this indicator has lots of other indicators in its structure. Oftentimes, when in use, a user may not need all the component indicators and since no one intends to read a seismograph, they may decide to turn off the dormant indicators.
Today is one of those times. We won't be needing a number of these component indicators due to the strategy we intend to use and so we'll have to setup up a lite version of the VuManChu Cipher B Indicator. The steps to achieve this on the Tradingview mobile app are outlined below.
STEPS
Step 1
Open the Tradingview mobile app and select a pair to open the chart page.
Step 2
On the chart page, click on Indicator in the top tab.
(Permit me to turn on the light so the settings can be very visible)
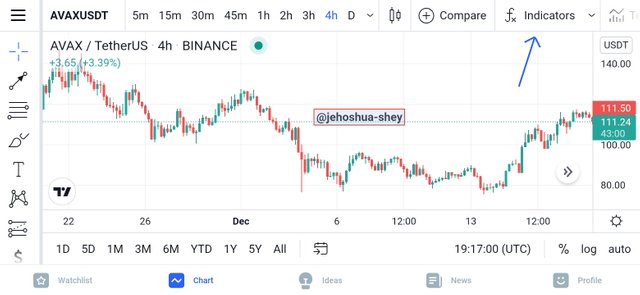 Screenshot taken from Tradingview mobile app
Step 3
In the search bar, type 'VuManChu Cipher B' and select the indicator as shown in the image below.
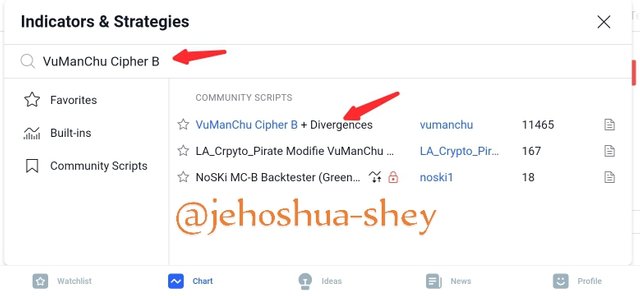 Screenshot taken from Tradingview mobile app
Step 4
The indicator appears after the previous step. Now we have to configure it to suit our preference. In this step, we call up the settings dialog box by clicking on the indicator title in the lower chart and clicking on the settings icon.
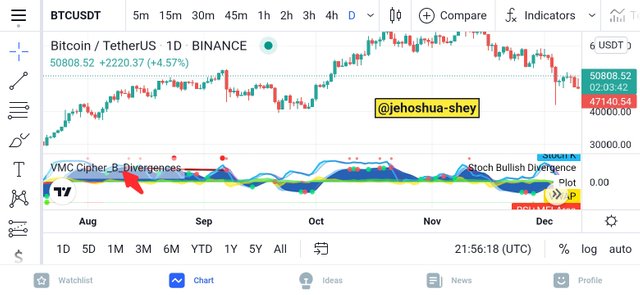 Screenshot taken from Tradingview mobile app
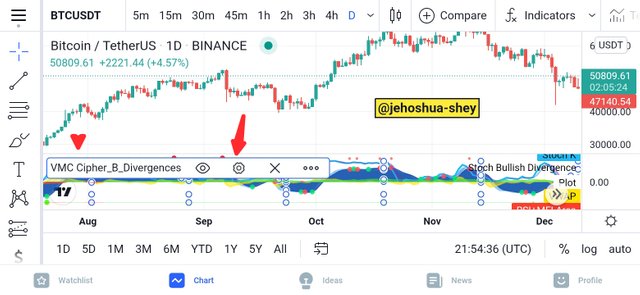 Screenshot taken from Tradingview mobile app
Step 5
For the strategy we intend to use, we won't be needing any divergences or Stochastic RSI so I'm this step, we'll ensure to keep all the boxes involving these two unchecked.
We'll uncheck the following boxes:
Show WT Regular Divergences
Show WT Hidden Divergences
Show 2nd WT Regular Divergences
Show Stochastic RSI
Their unchecked state can be seen in the images below
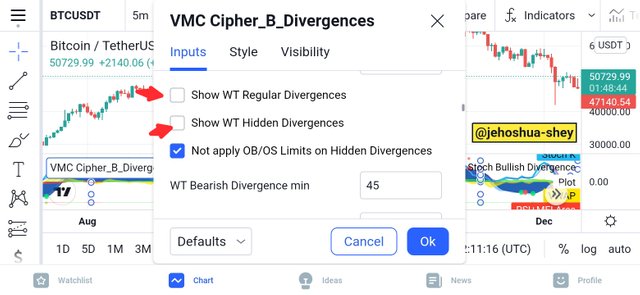 Screenshot taken from Tradingview mobile app
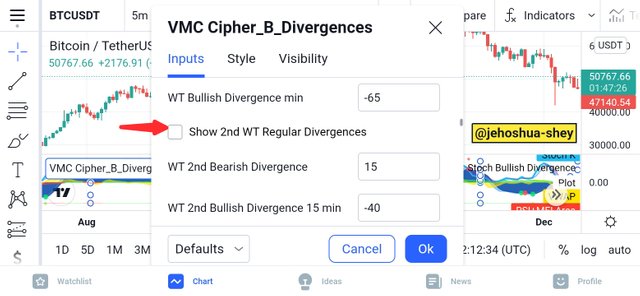 Screenshot taken from Tradingview mobile app
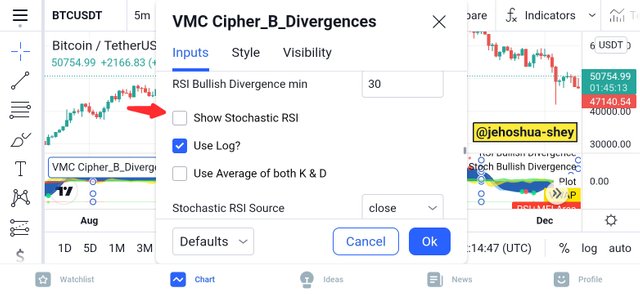 Screenshot taken from Tradingview mobile app
#####. Step 6
There are more to be unchecked in conditioning this indicator for our use. However, this time, we'll switch over to the style tab. We need to uncheck the following indicators:
VWAP (Volume-Weighted Average Price)
MFI color bars.
Their unchecked states can be found in the picture below
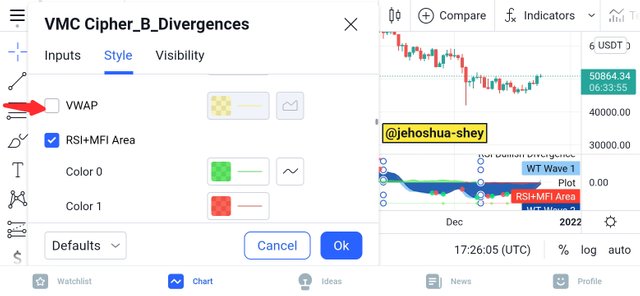 Screenshot taken from Tradingview mobile app
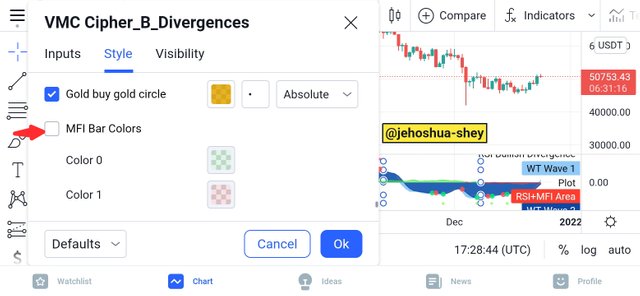 Screenshot taken from Tradingview mobile app
Once this modifications have been made, we will then have a setup that's easier on the eyes and meets our preferences.
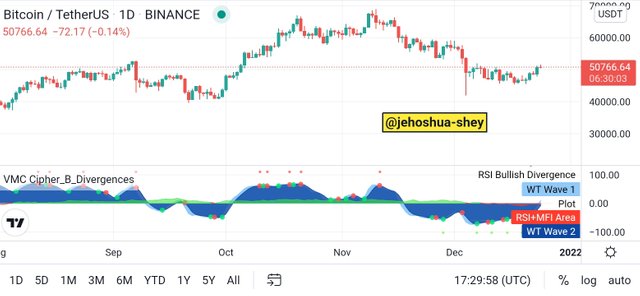 Screenshot taken from Tradingview mobile app
Q.3. Explain the appearance of the VuManChu Cipher B Indicator through screenshots. (You should Highlight each important part of this indicator by explaining their purpose)

From what we have left, we can easily identify each component of our indicator. Good enough it's on a separate chart underneath the candlestick chart. Our indicator consists of 3 major features. They include:
- The Wave Indicators: These are two wavelike indicators that cover a vast majority of the real estate where our indicator is found. These two wave indicators have two distinct colors - light blue and dark blue. they are shown in the image below

Screenshot taken from Tradingview mobile app
- Red and Green Dots At different points on the chart, these two waves cross each other. When this happens, a dot is formed. It is red if the light blue wave crosses below the dark blue wave and is green if the light blue crosses above the dark blue wave. These dots are shown in the image below.

Screenshot taken from Tradingview mobile app
- Money Flow Index: Aside from the waves and the dots, the next thing we see is the Money Flow Index. This index is the cloud that forms just about the zero point on the VuManChu indicator chart and it tells us the direction of money flow. When this feature is green, it is usually above the zero mark and signifies that money is flowing into the asset. The reverse is true when this feature is red. It is shown in the image below.

Screenshot taken from Tradingview mobile app

Q.4. Demonstrate your preparation for the Trading Strategy combining other indicators. (Instead of showing the addition of indicators to the chart, you should explain the purpose of each indicator for this trading strategy.)

To use the VuManChu Cipher B indicator, I'll prefer to combine it with other indicators as was done in the course. These indicators are bothe EMAs but of different periods. One is 55 periods EMA and another is the 200 periods EMA. Tonuse these two EMAs, I try to differentiate them by altering their colors. Thus, the image below is what we'll be having as our charts.
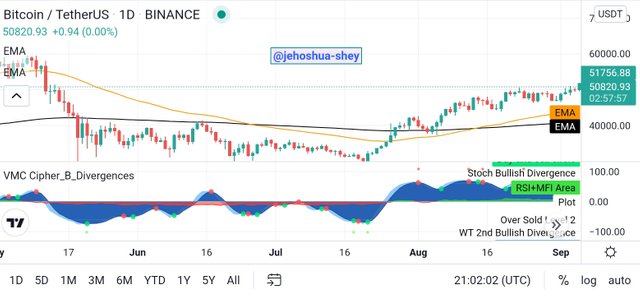
Screenshot taken from Tradingview mobile app
The black line is the 200 EMA while the yellow line is the EMA 55.
Note: That I cut out the steps on adding and configuring these two EMAs as it not required for this task.
The reason why we have these two EMAs is because we want to identify some clear signals by comparative analysis. We chose EMA because this indicator tends to smoothen out the price volatility pretty well.
The 55 EMA is an EMA with a relatively small period compared to the 200 EMA. Thus, it's relationship as per positioning, with respect to the 200 EMA can mean very important points on the chart.

Q.5. Graphically explain how to use VuManChu Cipher B Indicator for Successful Trading. (Screenshots required)

Using the VuManChu Cipher B indicator together with EMA 200 and EMA 55 is quite straight forward.
For a buy entry,
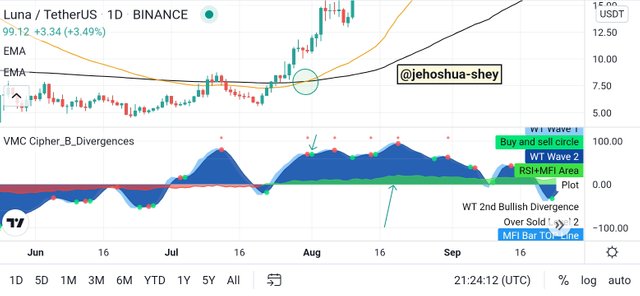
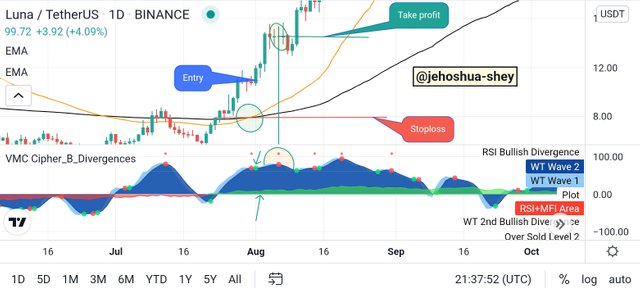
Wait for 55 EMA to cross above 200 EMA. Then observe the VuManChu Cipher B indicator, if the money flow indicator is green, then we move onto the last confirmation, we wait until the wave indicators have done a bullish crossover
In the image below we see a complete illustration observing all these conditions.
Screenshot taken from Tradingview mobile app
In this cases, we can see the cross over of the 55 EMA above the 200 EMA. We can also see the green dot as well as the green Money Flow Indicator.
We can enter at our trades once all these confirmations are observed. For exit, we set our stop loss at the most recent support and our take profit at the next red dot or bearish wave indicator crossing.
Screenshot taken from Tradingview mobile app
For a sell entry,
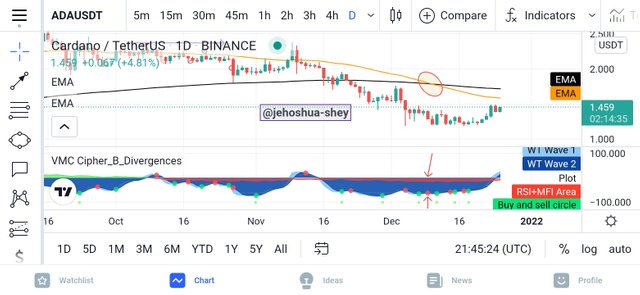
Wait for 55 EMA to cross below 200 EMA. Then observe the VuManChu Cipher B indicator, if the money flow indicator is red, then we move onto the last confirmation, we wait until the wave indicators have done a bearish crossover
In the image below we see a complete illustration observing all these conditions.
Screenshot taken from Tradingview mobile app
In this cases, we can see the cross over of the 55 EMA below the 200 EMA. We can also see the red dot as well as the red Money Flow Indicator.
We can enter at our trades once all these confirmations are observed. For exit, we set our stop loss at the most recent resistance and our take profit at the next green dot or bullish wave indicator crossing.
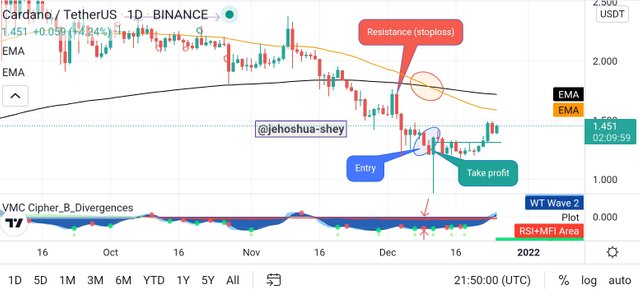
Screenshot taken from Tradingview mobile app

Q.6. Using the knowledge gained from previous lessons, do a better Technical Analysis combining this trading Strategy and make a real buy or sell order in a verified exchange. (You should demonstrate all the relevant details including entry point, exit point, resistance lines, support lines or any other trading pattern)

I made a trade using the strategy discussed in this task. However, due to club5050 restrictions, I could only do a demo trade.
I made an entry for ETH on a ETHUSDT 2H chart after I saw the 55 EMA cross above 200 EMA, Money Flow Indicator colored green and green dot formed below the zero line
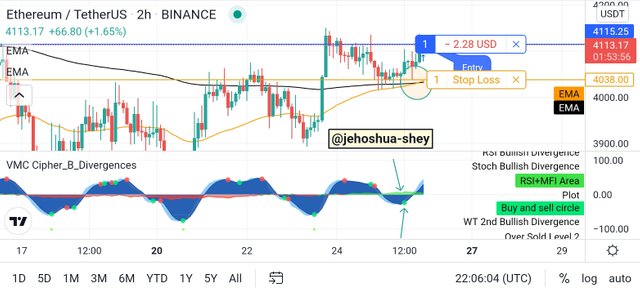
Screenshot taken from Tradingview mobile app
I placed my stoploss at the most recent support marked by the yellow line. My take profit would be at the next red dot or bearish wave indicator crossing.
Proof of trade
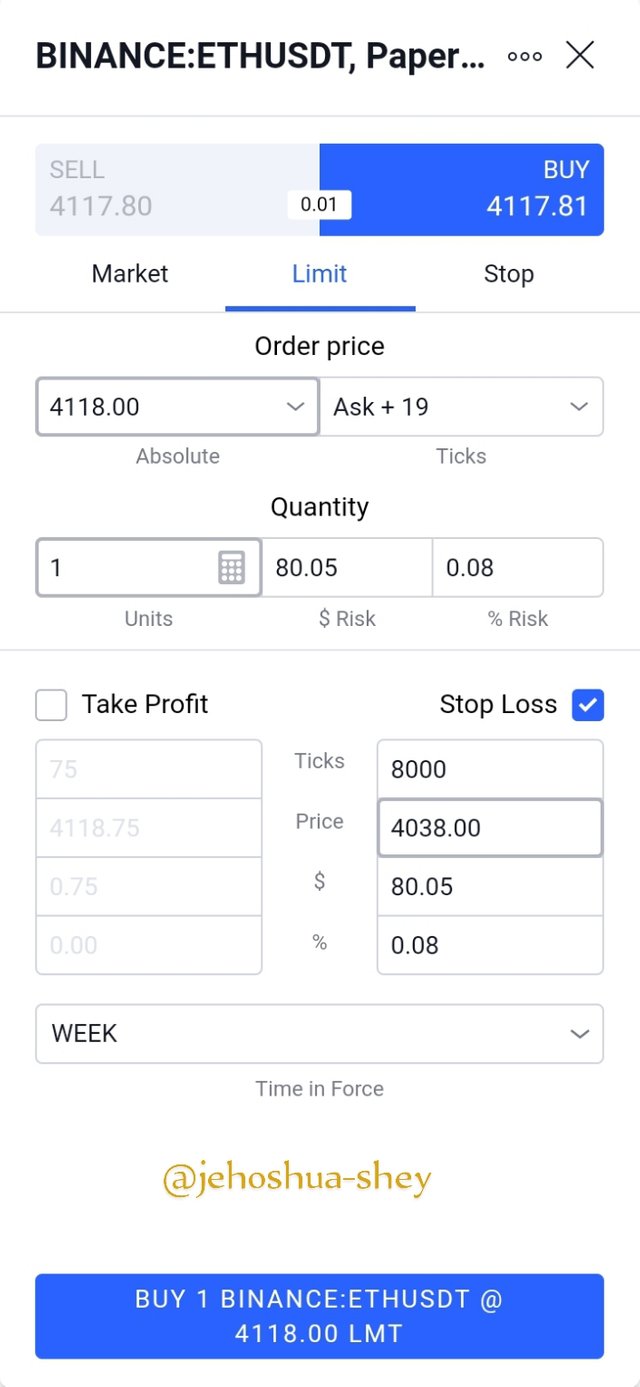
Screenshot taken from Tradingview mobile app
Thanks for reading
Cc:
@reddileep