Season 4 Beginner's Course - Task 10: Candlestick Patterns || By @jaspichman125
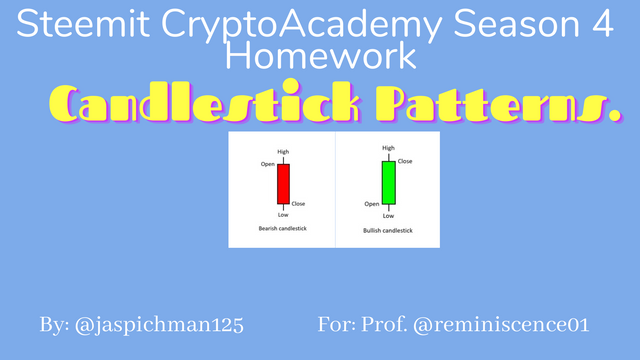
Hello professor @reminiscence01 this is my homework post. Thanks for the wonderful presentation/lecture.
1a) Explain the Japanese candlestick chart? (Original screenshot required).
b) In your own words, explain why the Japanese Candlestick chart is the most used in the financial market.
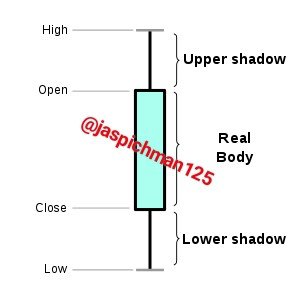
c) Describe a bullish and a bearish candle. Also, explain its anatomy. (Original screenshot required)
First and foremost, I would like to define what a chart is.
In my own opinion, a chart is the orderly representation of a data in a graphical or pictorial form. The data is arranged in array such that it becomes easier to derive information from it. A chart can be represented in several ways such as a line chart, bar chart, pie chart, pictogram, etc.
When it comes to cryptocurrency, stocks, bonds or Forex trading, the chart provides investors, buyers, sellers and analysts the basic information that they need to make profitable trades or decisions.
There are different types of charts that are being utilised for different purposes. Below are some types of charts that used in in cryptocurrency trading.
Candlestick charts: this is a technical tool that compresses multivariable data into a simple form which helps investors, traders and financial advisors and technical analysts to predict price movement or momentum of a particular asset class e.g. cryptocurrency.
Bar chart: in this type of chart, data is arranged in form of rectangular bars from which information can be drawn-out by investors, traders, technical analysts, and financial advisors.
Line chart: this is not different from the aforementioned types of charts except that lines instead of bars or candlesticks are used in data representation.
Market profile charts: this type of chart is slightly different from the ones discussed earlier because prices and volume of the particular asset is being used to represent the data from which both short-term and long-term investors can derive valuable information so as make an informed decision.
Cryptocurrency market is highly volatile, meaning, prices are not constant; they rise and fall at any given time which in most cases is unpredictable. The “up and down" movement of prices is determined by candlesticks formation.
The Japanese candlesticks was first developed by one Steve Nison in his book titled Japanese Candlestick Charting and Techniques. He Japanese candlesticks have peculiar features that helps investors, traders (buyers and sellers), financial advisors as well as technical analysts to make profitable decisions or trades.
Some features of the Japanese candlesticks are:
The open day price: this determines the opening price of a particular asset at any given time. When the “open” is lower than the “close" at any given time period, it signifies a rise in price and vice versa.
Close day: if the “close" is lower than the “open”, it indicates a drop or fall in price of the particular asset and vice versa. If the close is above the open, it signifies a bullish market which is denoted by a green candle.
Shadow (high-low): there’s upper (high) and lower (low) shadows. The upper or high shadow indicates high session of trading activities while the lower shadow signifies low or little trading volumes. It is noteworthy that not all candlesticks have shadows.
The body: Whenever the body is long, it signifies an intense session of buying. A short body indicates that there’s little buying with high selling activities going on in the market. The body also shows the range (the difference between the opening price and closing price i.e. closing price minus opening price).
There are several factors or reasons why the Japanese candlestick is the most widely used chart in financial markets. Some of the reasons are outlined below:
It’s simplicity: the anatomy of the Japanese Candlestick is easy to understand even by novices or newbies
Information can easily be extrapolated from the Japanese Candlestick chart
The Candlestick pattern is easy to form
The Candlestick pattern helps traders, investors, technical analysts, financial advisors, decision makers, etc.
It helps traders to monitor price movement of assets
It helps traders and investors to forecast or predict future prices of assets.
It reveals the hourly, daily, weekly, monthly, seasonally and yearly trading volumes of asset.
Bullish Candle:
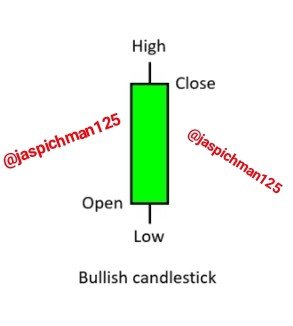
a bull candle is indicated by a green colour. It’s open is lower than the close. The close is at the top of the candle while the close is at the bottom.
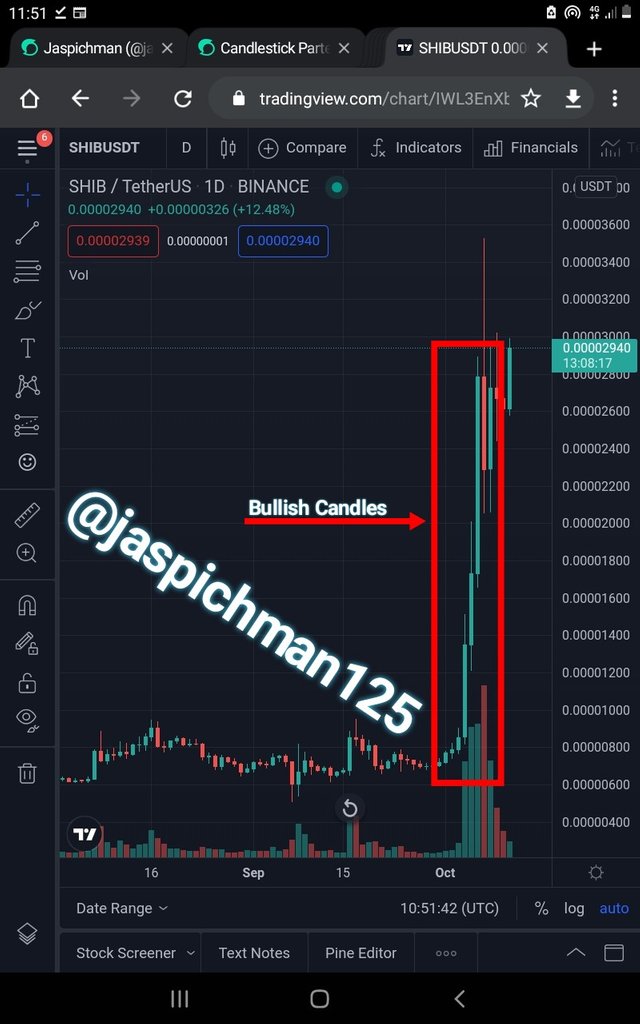
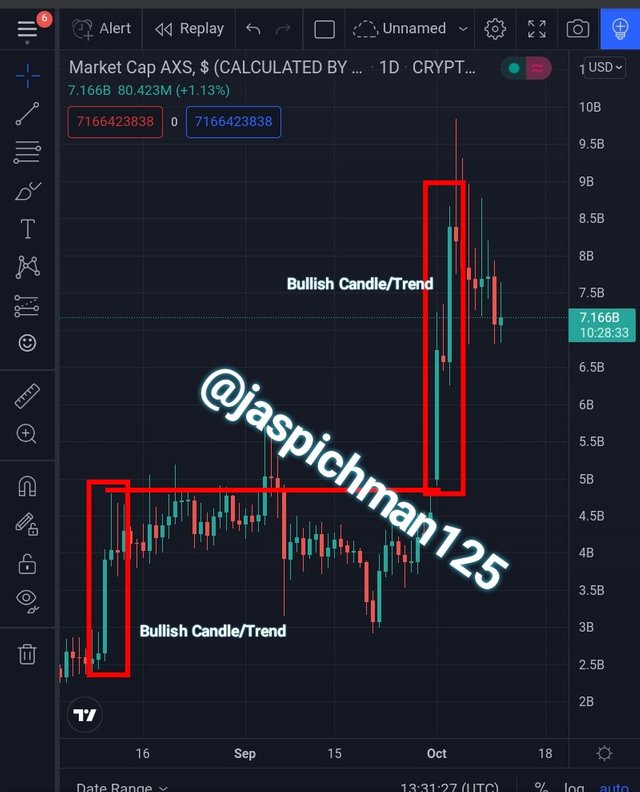
Usually, Bullish candles opens above the close of the previous day’s bearish Candle. In other words, it closes the bearish momentum and opens a Bullish run.
Recall that, traders and investors use the candlesticks pattern to monitor and predict the price momentum or price movement of assets in the financial markets.
Therefore, we can safely conclude that the opening price in a Bullish market at any given time is lower than the closing price in the same period of time.
When the above statement is true, it shows that, there’s an increase in price of the particular commodity or assets under review.
Bearish Candle:
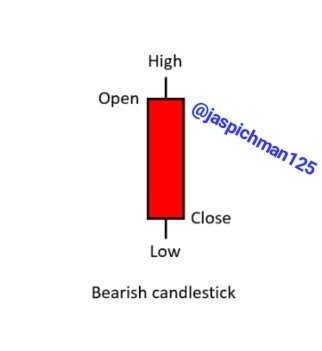
is formed after a Bullish Candle. There’s always a Bearish Candle at the end of a Bullish run. It happens when the price of a particular asset is on a downtrend, it means the market is Bearish – as indicated by red candles. When the opening price is higher than the closing price, we say the market is bearish.
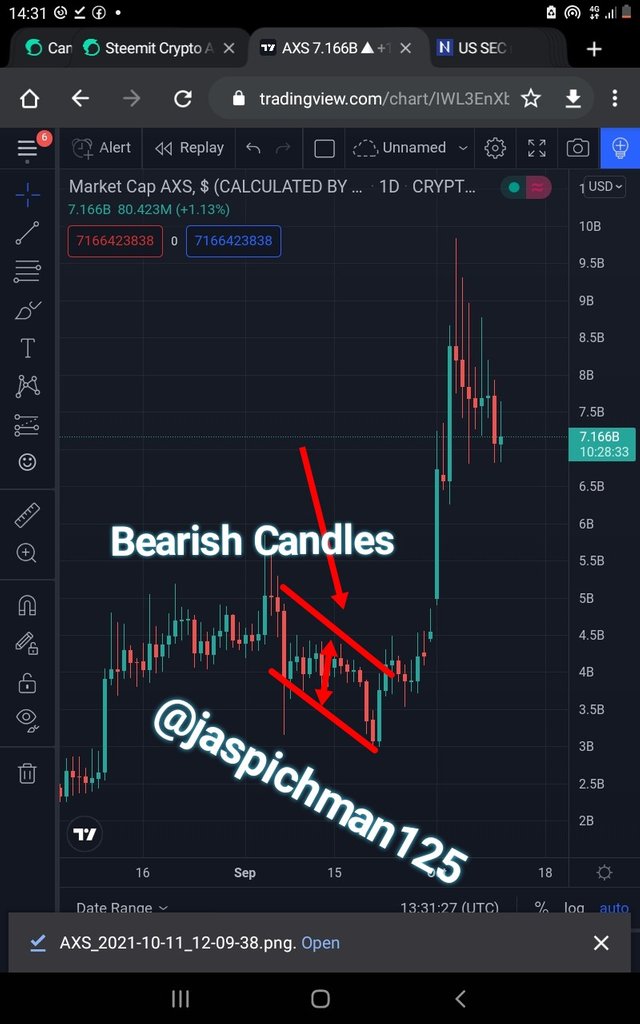
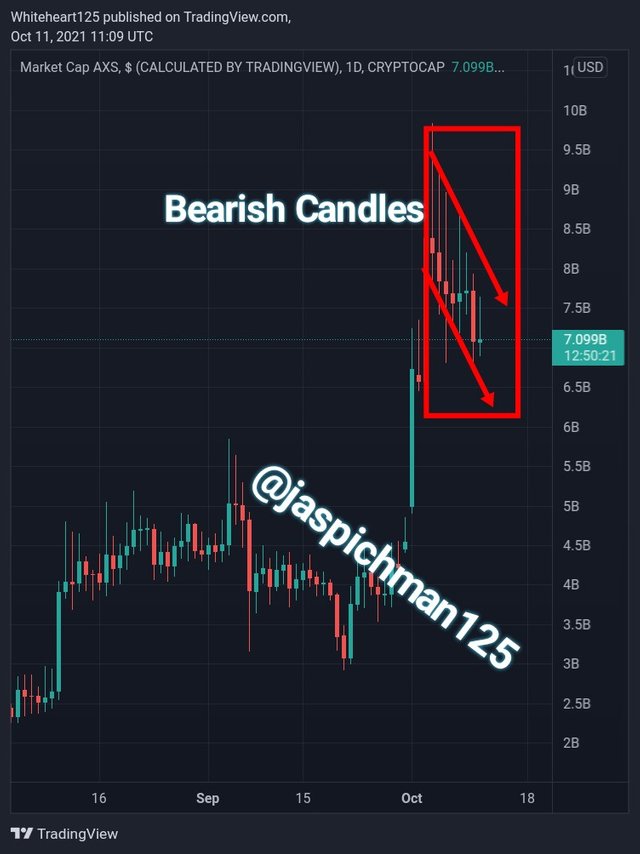
This phenomenon is often represented by a downward price movement indicating the fall in price of the asset.
What causes the bear market often times is when investors sell off their assets either due to the fear of missing out (FOMO) or just to take some profits from their investment. That is why the bear market is otherwise called as the sellers market.
Candlesticks are technical tools that helps traders, investors, technical analysts, financial advisors in their decision making in the financial market.
The Candlesticks shows only the “tendencies” of price movement (up/down) not ”guarantee”, meaning, there’s no certainties about future prices of assets.
Therefore, traders and investors should be careful in making their decisions based on the information derived from the Candlesticks.
A good understanding of the Candlesticks helps the traders and investors to know who controls the market price between the buyers and the sellers.
Investors can take advantage of both the bear market and the bull market: during bullish market, investors takes profits 📈 while during bearish market, they invest or buy more coins or tokens at lower prices in anticipation of future increase in price of the particular asset.
Thanks for reading through my homework
Best regards; @jaspichman125
Special thanks to professor @dilchamo