Trading Strategy with Median Indicator - Steemit Crypto Academy |S6W4| - Homework Post for Professor @abdu.navi03
Hello everyone and a warm welcome to steemit crypto academy season 6 week 4
1-Explain your understanding with the median indicator.
2-Parameters and Calculations of Median indicator. (Screenshot required)
3-Uptrend from Median indicator (screenshot required)
4-Downtrend from Median Indicator (screenshot required)
5-Identifying fake Signals with Median indicator(screenshot required)
6-Open two demo trades, long and short, with the help of a median indicator or combination that includes a median indicator (screenshot required)

Explain your understanding of the median indicator.
The median indicator can be regarded as a trend-based technical analysis indicator that is used by traders to perceive entry and exit signals, The median indicator simply displays the average median value of our individually chosen trading period.
The indicator is calculated by averaging the open and closing over the chosen custom period, for instance, if assets opening price over a custom of 3 periods range is 12,14 and 16 while the closing price is 20,22 and 24 the median indicator will in this case display a median value of 14 for the Opening price and 22 for the 3-period range chosen by averaging the value for the period and dividing it by the number of period range.
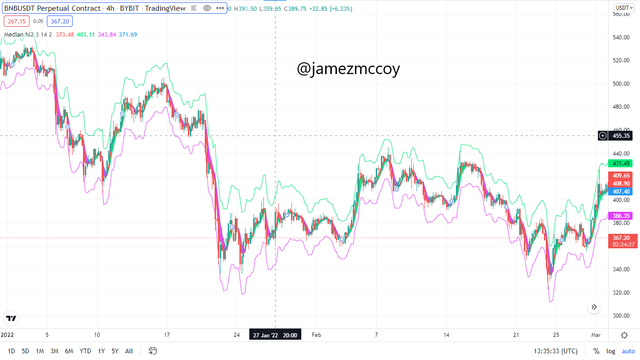
The median indicator is plotted with an Average True Range which takes current high and current lows to provide a median value with an upper band depicting the maximum height a volatile asset is expected to reach and a lower band which depicts the maximum low the volatility of an asset is not expected to go below and in between will be the average median value as seen in the image below. A bullish trend with the median indicator can be perceived with a greenish cloud while a bearish is perceived with a reddish cloud
2-Parameters and Calculations of Median indicator. (Screenshot required)
As we are most familiar with the majority of the indicators in the crypto world are conceived from mathematical values and concepts and the median indicator is no different. The calculations involved include
- The median length
The median length indicates the number of data points that is being used in calculating the median value which is set to default as 3.
- ATR
This parameter involves the amount of time being put when calculating the median value which is in this case with a default value of 14
- ATR Multiplier
This parameter is the value multiplied to get the upper band and the lower band above and below the median value which has a default of 2
upper-band = Median length+[2atr]
lower-band = Median length-[2atr]
PARAMETERS
- INPUTS
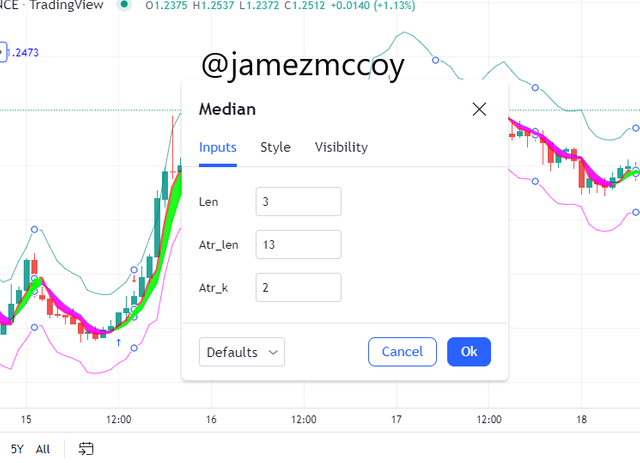
This is one of the most important parameters, here once can choose to change the number of data being calculated by the period or change the default length of the median indicator
- STYLE
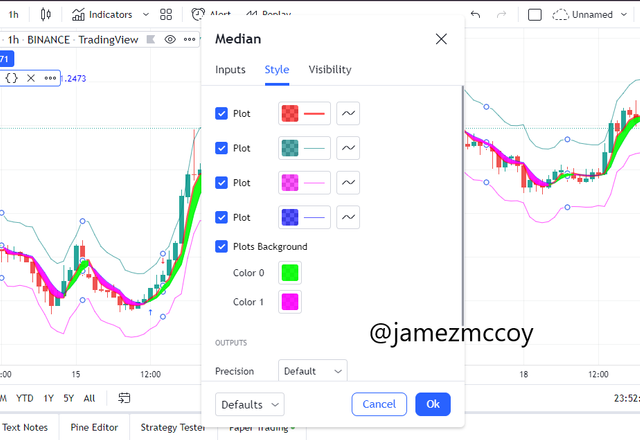
This parameter's primary purpose is to allow the user to customize colors in the indicator and set it to the most convenient to the traders taste
- Visibility
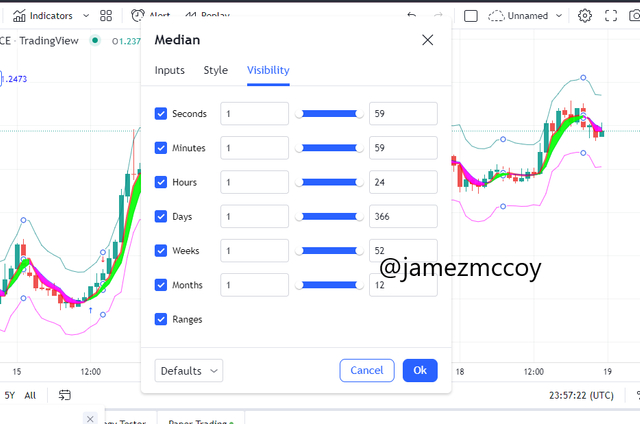
The visibility parameters allow the user to pick a preferred view.
3-Uptrend from Median indicator (screenshot required)
The median indicator being a cloud-based indicator can be a suitable tool for analyzing trends and predicting future price movements, the best buy position is usually opened from a reversal from a downtrend mostly after a cross-over with the EMA in the chart and the price action is observed to rise above the median value of the indicator.
An uptrend can be confirmed when the appearance of green color in the trend is observed and the price action is observed above the green color as can be seen displayed pictorially below.
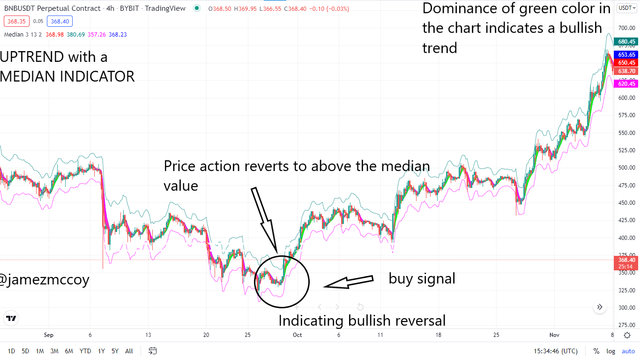
Clear domination of the green candlestick as a result of the price action being above the average median value is the fastest way to perceive when an asset is in an uptrend and entries can be made anywhere after safe confirmation of the uptrend. Due to the nature of the indicator, one will have to be active to set a stop loss or take profit when the chart trends change and domination of the pinkish color is noticed.
4-Downtrend from Median Indicator (screenshot required)
A downtrend can easily be identified with the median indicator in that we simply look for active domination of the pinkish color on the price action which will be located beneath the price action
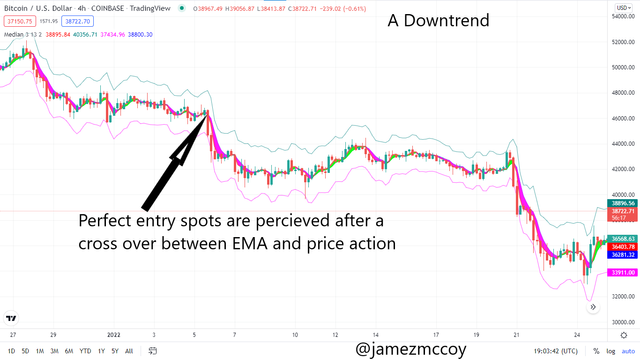
As we can see from the screenshot of the image above of the BTC/USD, our asset's price action ended its a bullish trend at about 51700, and a perfect bullish trend is perceived as our median value the EMA and our price action experienced domination in the dominance of the pinkish trend and our bands are eloping in a downward direction also implying a downtrend. A take profit can not be added due to any analysis with the indicator as the indicator is a trend indicator and it is not paired with any other indicator one would have to be active and monitor trends and make an exit or take profit when one notices a change in trend or domination of the green color in the chart.
5-Identifying fake Signals with Median indicator(screenshot required)
The median indicator is a trend based indicator which implies that with the indicator solo one can confidently make entry and exits positions all depending on the trader technical analysis percept and ability to discern legit signals from fake entry signals or false market movement
Like every other indicator in the world of technical analysis the median indicator if not studied and one acclimatized with it in-depth can get a lot of fake entry and exit signals and end up losing a lot of capital or make bullish entries when a downtrend is just beginning
To further improve our chances of profit and to be able to filter fake signals even more we will be pairing our median indicator with the RSI which is a momentum-based indicator to further improve our entry and exit accuracy. The RSI being a momentum based indicator is very capable of telling you when a market is overbought or oversold with this information we can fine-tune or market entries and exits
In situations where our RSI is showing overbought and our Median indicator is showing color green that might be a false signal and at the same time might also be a possibly good entry but to be more certain and avoid getting caught in false signals we only make buy entry when our RSI is in the Oversold region that is beneath 30 and our Median indicator is just turning green.
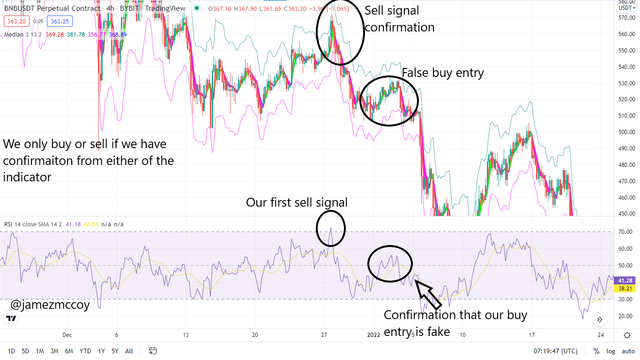
N: B to filter false buy signal one can easily look for a correlation between the RSI and the Median indicator. If the RSI is not in the Overbought signal no buy signals should be taken that way we cant get in on any false signal and vice versa for the sell signal
6-Open two demo trades, long and short, with the help of a median indicator or combination that includes a median indicator (screenshot required)
BUY ENTRY
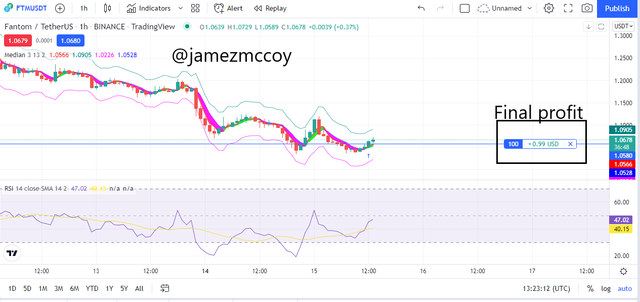
For the purpose of this question i will be opening my demo trade in the paper trading demo accounts, I will be pairing my Median indicator with the Momentum based RSI indicator for a market entry.
My first condition for my buy entry would be that my RSI indicator has to be very well below 30 indicating the market is in an oversold region which means we are well to anticipate a long position, then finally i would await a confirmation from my median indicator turning green and the price action reverting above the EMA, when all this is confirmed then i would make my buy entry as is seen below.
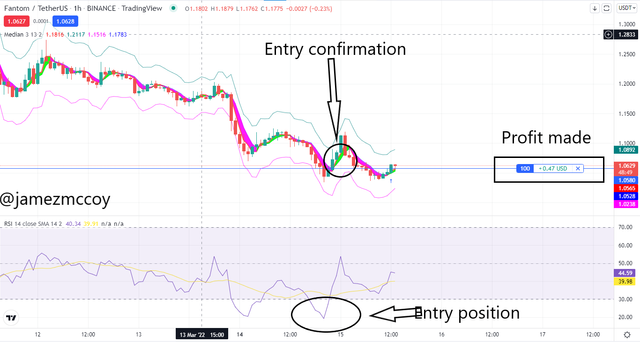
In my FTM/USDT pair we can see that my RSI was my first signal giveaway, the RSI had a value above 30 so i anticipated a bullish movement and since i was scalp trading i had to be active to take profit which i did at 99cents
SELL ENTRY
For our sell entry, we would be doing quite the opposite of our proceeding for the buy entry, in this case our first condition would be that the RSI has to be well above the 70 percentile range indicating our asset is in an overbought region hence a market reversal is to be anticipated, we would then observe for a confirmation from the Median indicator when a pinkish color is observed and our price action reverts beneath the EMA then our sell order can be entered
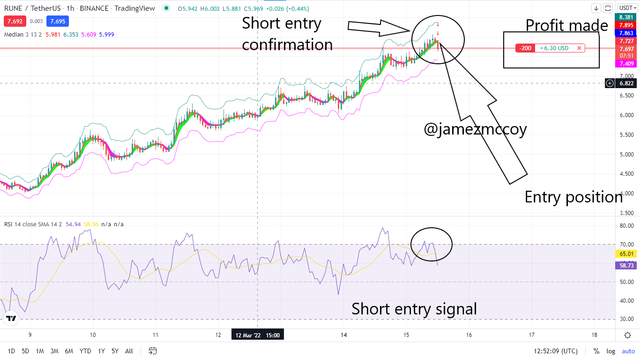
From the look on our chart above our entry was made after our confirmation was made when the pinkish color was apparent in our chart and our first signal was perceived when the RSI went above 70 indicating overbought. I made a profit of 11$on the RUNE/USDT pair a total before closing my position I had no stop loss cause I was actively monitoring the open chart
CONCLUSION
The median indicator overall is a very effective and efficient indicator, but we can see how much more accurate it became when it was paired with the RSI indicator, for an even more effective trading i tested the indicator some more with additional indicator and the result was a lot more better. A very explicit course by Professor @abdu.navi03