Fibinacci Tools - Crypto Academy / S6W4 - Homework post for pelon53.
1.- Explain in your own words what you mean by Fibonacci retracement. Show an example with screenshot.
2.- Explain in your own words what you mean by the Fibonacci extension. Show an example with screenshot.
3.- Perform the calculation of the Fibonacci retracement, for the levels of: 0.618 and 0.236. Pick a crypto pair of your choice. Show a screenshot and explain the calculation you made.
4.- On a Live account, trade using the Fibonacci retracement, screenshots are required.
5.- On a Demo account, make a trade operation using the Fibonacci extension. Screenshots are required.

QUESTION 1
1.- Explain what you mean by a Fibonacci retracement in your own words. Show an example with screenshot.
The most efficient and beneficial trades in the crypto world are those opened during high and very volatile trends, riding trends are very helpful but being caught on the wrong end of it can be very dangerous too. The Fibonacci retracement levels were originated from the Fibonacci series which is a summation of the two previous numbers, the concept was brought to light by the Italian mathematician Leonardo Pisano
The Fibonacci retracement level is an important technical analysis level that works best with trends for any trader and also worth mentioning it has key levels which are 23.6%, 38.2%,50% 61.8% and 78% and has the its highest percentage to be 100% and thee lowest which implies the Fibonacci retracement level does not exceed 100%,the Fibonacci retracement is made up of individual lines which in some cases can serve as support or resistance lines in an active chart.
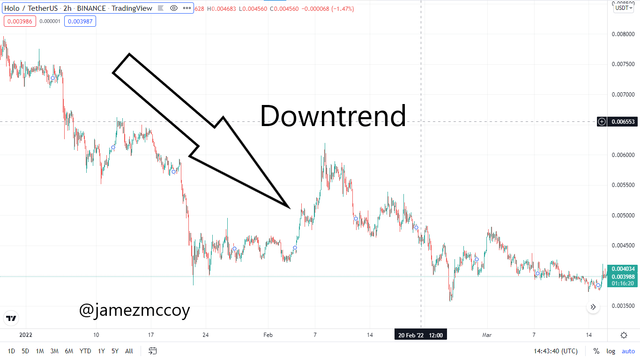
The Fibonacci retracement levels are often drawn from the highest peak or lowest to the lowest or highest depending on the direction of the trend most often for the purpose of telling the areas where the price action is most likely to react with the support or resistance line created by the Fibonacci retracement levels.
Usually in uptrends using the Fibonacci retracement levels the trader would connect the price action's recent swing low against the assets swing high while and make a long entry when the asset's price action reacts with any of the levels support level while in the Downtrend using the Fibonacci retracement level one would have to do exactly the opposite of everything done in the uptrend trade.
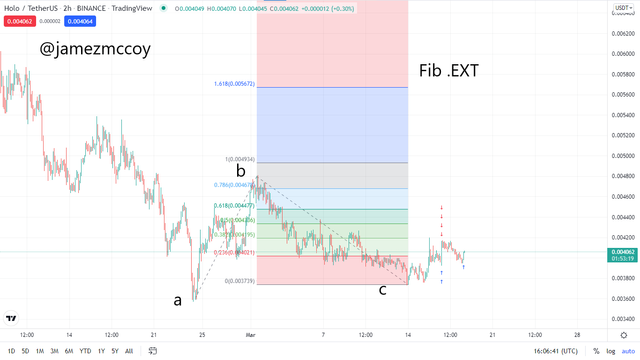
2.- Explain in your own words what you mean by the Fibonacci extension. Show an example with screenshot.
The FIbonacci Extention tool is an important technical analysis tool that can be created in the same concept as the Fibonacci retracement levels, the Fibonacci retracement level is used primarily to perceive how far the price of an asset can move before it reverses which implies that this tool can be very important when trying to determine stop loss or take profit areas in active trade.
The Fibonacci extension tool is a technical analysis tool that can be used to predict possible future reversal or pull back areas of price action, unlike the Fibonacci retracement level the Fibonacci extension is seen above 100%, and also unlike the Fibonacci retracement level the Extention is applied in a chart by connecting 3 points in a chart
The Fibonacci extention, in this case, involves connecting an assets swing high or low against the swing low or high and lastly connecting the most recent pull depending on the direction we are trading towards wll determine what swing we are connecting to what.
Source
In the Fibonacci extensions during uptrends long entries are made when we have connected our assets swing high against our swing low then to our most recent retracement, often after confirmation of trend direction is done and a retracement is perceived often in the same direction as the initial trend and vice versa for a downtrend.
3.- Perform the calculation of the Fibonacci retracement, for the levels of: 0.618 and 0.236. Pick a crypto pair of your choice. Show a screenshot and explain the calculation you made.
From our insight so far we can tell that the Fibonacci retracement is all based on mathematical expression, that being said each level has its unique set of mathematical values, the factors needed to calculate any Fibonacci retracement level would be just the Swing high and the Swing low.
The general formula used in calculating any Fibonacci retracement level would be
R = X + [(1 - %Retrace/100) x (Y - X)]
Where :
X = The initial value at the beginning of the Fibonacci.
Y = The maximum value of the price at which the Fibonacci Retraces.
The Fibonacci level has five known levels i.e
% retrace 1=%23.6
% retrace 2=%38.2
% retrace 3=%50
% retrace 4=%61.8
% retrace 5=%78.6
FOR Retracement 1
Values from the BTC/USDT pair below
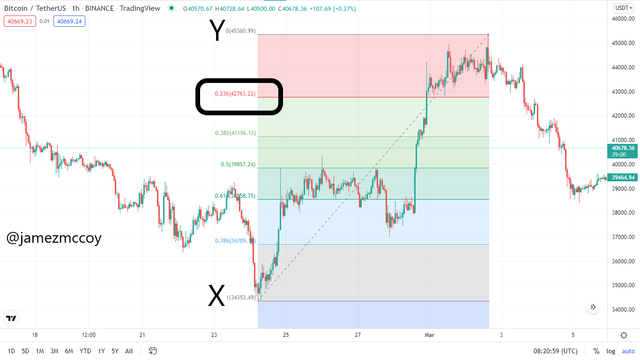
0.236
R1 = X + [(1 - 0.236) * (Y-X)]
X = 34353.49 USDT
Y = 45360.99 USDT
To calculate our first retracement we would be inputting the value
R 0.236 = 34353.49 + [(1-0.236) × (45360.99-34353.49)]
R 0.236 = 34353.49 + [(1-0.236) × 11007.5
R 0.236 = 34353.49 + (0.764 × 11007.5)
R 0.236 = 34353.49 + 8409.73
R 0.236 = 42763.22USDT
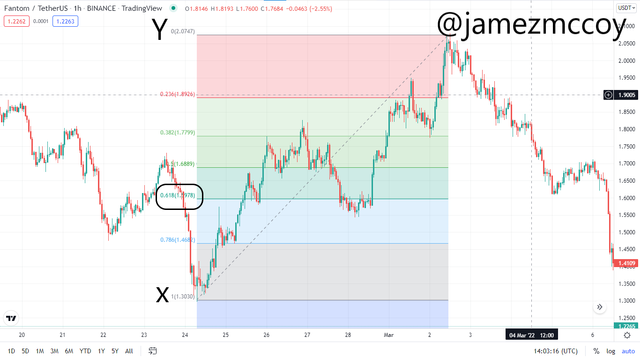
0.618
For Retracement 4 i.e 0.618
We will be using the FTM/USDT pair to perform our calculations in this phase
Source
R4 = X + [(1 - 0.618) * (Y-X)]
X = 1.3030 USDT
Y = 2.0747 USDT
To calculate our second retracement we would be inputting the value
R0.618 = 1.3030 + [(1-0.618) × (2.0747-1.3030)]
R0.618 =1.3030 + [(1-0.618) × 0.7717
R0.618 =1.3030 + [(0.382 × 0.7717)]
R0.618 =1.3030 + 0.29479
R0.618 = 1.5978
If we observe the screenshot for both 0.236 and 0.618 above we will observe the circled part corresponds with the answers i got from my calcutions of both retracement levels.
Source
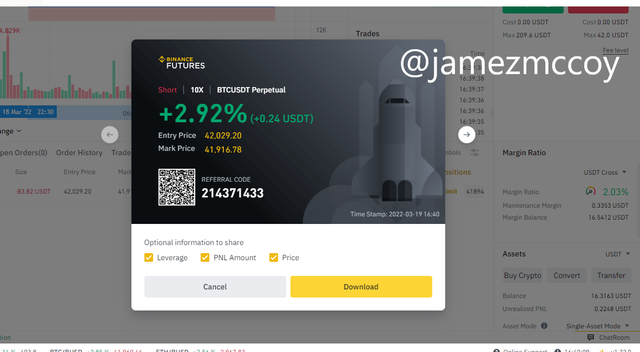
4.- On a Live account, trade using the Fibonacci retracement, screenshots are required.
For the sake of this course i will be making my live trade entry on my binance desktop app. I will be making a short entry to the BTC/USD which implies i will be connecting my swing low to my swing high and make entry on retracement, i will be analyzing the chart pair on a 15 min time frame
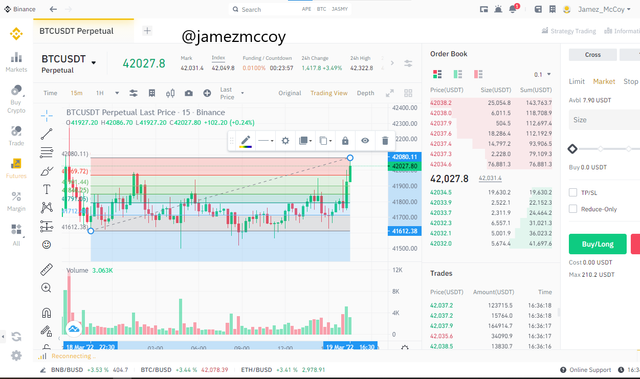
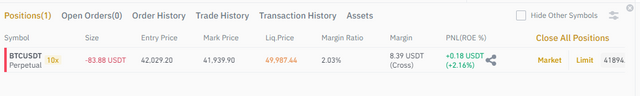
My short entry was made at 42,001 at the close of the trade i had made 0.22$ profit
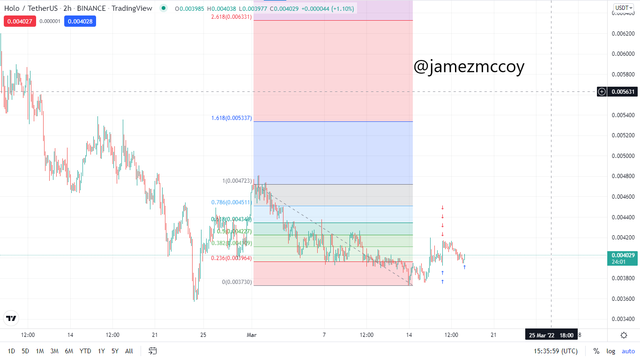
5.- On a Demo account, make a trade operation using the Fibonacci extension. Screenshots are required.
For my demo trade, I will be performing my entry with the help of the Fibonacci extension tool.
Source
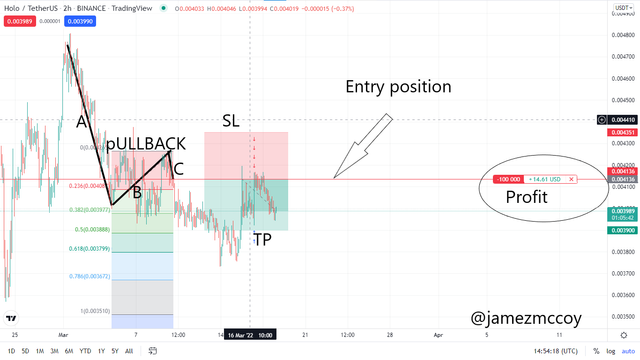
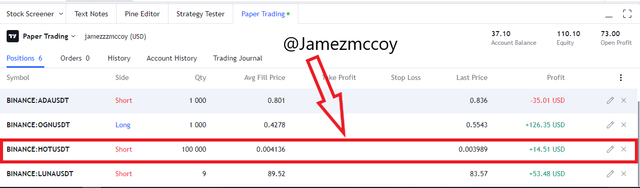
I will be making a short entry as our number one rule in crypto trading should always be to never trade against a trend except in cases where a trend reversal is noticed, for the Fibonacci extension entry I will be making my short entry on the HOT/USDT pair. After tracing my swings highs and lows and making the proper connection I made my Sell order entry at the most recent retracement. I had my stop loss to take profit ratio of 1:1.5. At the time of closing the trade, i had made a 14$ profit.
CONCLUSION
The Fibonacci is a great tool that provides crucial data that can be very useful when making market entries or exits or when setting stop losses or taking profits, the Fibonacci levels create important to support and resistance level where price actions react with on multiple occasions.
In my demo trade using the Fibonacci extension, we can see that the price action reacted with the first support line and continued in its previous trend direction, with the help of the Fibonacci levels we can accurately map out potential support and resistance levels and make our entries or exits at those levels. Thanks to professor @pelon53 for this amazing course