SEC S18-W5 || Mastering Trading with Stochastics and Parabolic SAR
Assalamualaikum Steemian |
|---|
With the prayers of my well-wishers I'm doing great and so do I wish for you all, beautiful people. Today, I'll write on the topic "Mastering Trading with Stochastics and Parabolic SAR" organized by @crypto-academy Here is my view about the concerned topic.
Explain the components of the Stochastic Oscillator. How does it help in identifying overbought and oversold conditions in the market? |
|---|
Stochastic Oscillator is a momentum indicator. It's lagging indicator. It consists of two components.
01. %K: This Line is also referred as "Fast stochastic" which measures the recent closing price relative to the lowest low and highest high in any given time period usually 14 days.
Formula
%K= (C-L14/H14-L14)×100 where:
C= Current Closing price
L14= Lowest price in last 14 days
H14= Highest price in 14 days
02. %D: This line is also referred as "slow stochastic" and is a moving average of line %K.
The two Lines gave us the trade calls in the following ways:
01. Buy Signal: When The %K line crossover the %D line from below, it's a buy opportunity.
02. Sell Signal: Whe the %K line crossover the %D line from above, it's a sell call.
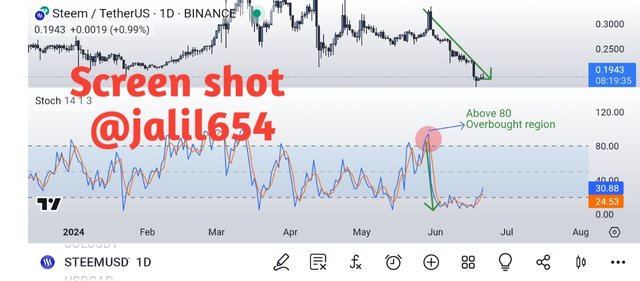
Like RSI, Stochastic indicator also gave use the overbought and oversold conditions with additional confluences that RSI doesn't gave. Stochastic Oscillator ranges from 0-100 which indicates the overbought and oversold regions.
Overbought:**
When the %K line ranges in 80 or above, it indicates that it's in overbought region and is a sell call.
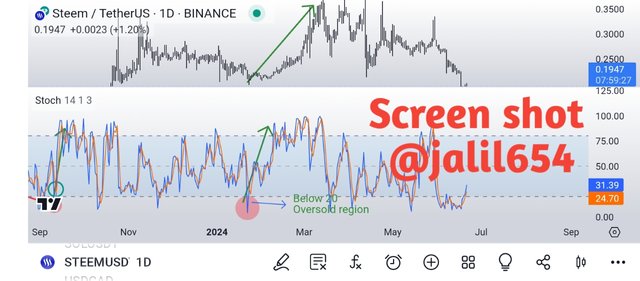
Oversold:
When the %K line ranges in 20 or below, it indicates that it's in oversold region and is a buy call.
Describe the Parabolic SAR indicator and its application in identifying the trend direction. How is it interpreted differently in an uptrend compared to a downtrend? |
|---|
SAR stand for "Stop and Reverse". Parabolic SAR is a series of Dots that are placed below or above the price. It's an indicator that is used to identify the trend direction as well as its strength. It's also a lagging indicator. It work best in trending market and not in consolidation phase.
We can identify the trend direction in the following ways:
Uptrend
In uptrend direction, the dots are below the price action and act as a support.
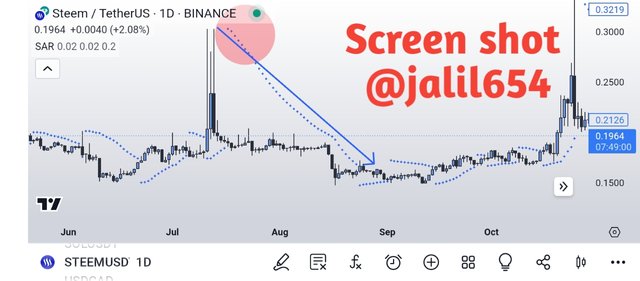
Downtrend
In downtrend, the dots are above the price action and act as a resistance.
Uptrend
In uptrend, the dots are formed below the price. As the price rises, the dots go the same way, indicating a strength. If the price fall and come close to the dots, the price may bounce back from there as the dots act as a support. But if it breaks below the dots, we might see a reversal.
Downtrend
In downtrend, the dots are formed above the price. As the price falls, the dots move the same way, indicating a strength. If the price rises and come close to the dots, we might see a pullback as the dots act as a resistance. But if it breaks above the dots, we might see a trend reversal.
How can the combination of the Stochastic Oscillator and Parabolic SAR be used to create a robust trading strategy? Provide a detailed explanation |
|---|
For the combination of the Stochastic oscillator and Parabolic SAR, we'll have to apply both of them on the Chart and identify the trend with the Parabolic SAR.
Long Entry
- Firstly, the parabolic SAR must represent an uptrend(dots below the price).
- Stochastic Oscillator is in oversold region. ie., %K in below 20 range.
-The %K line of stochastic oscillator pass the %D line from below. - Wait for the price to rises above the dots of parabolic SAR and then Enter LONG position.
Short Entry
- Firstly, the parabolic SAR must represent a downtrend(dots above the price).
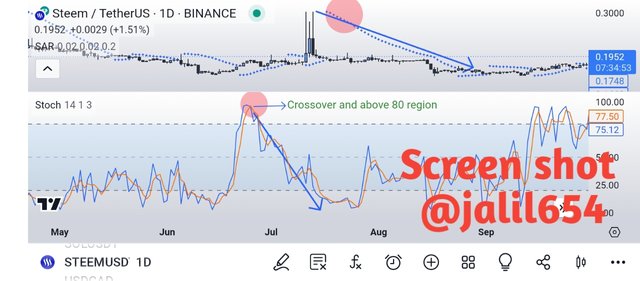
- Stochastic Oscillator is in overbought region. i.e., %K in above 80 region.
- The %K line of Stochastic Oscillator pass the %D line from above.
- Wait for the price to falls below the dots of parabolic SAR and then enter SHORT position.
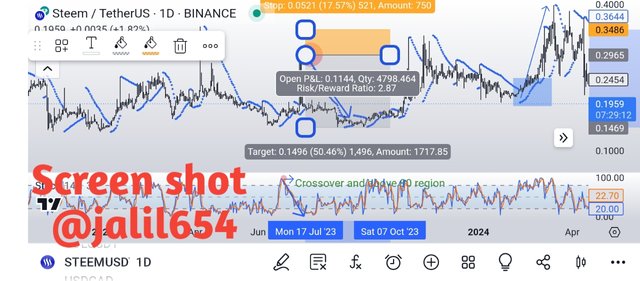
01.Stop loss:
At the recent swing low/high
02. Take Profit:
2X distance of stop loss. i.e., 1:2 risk Reward ratio.
Using historical data, analyze a trading scenario for the STEEM/USDT pair where the Stochastic Oscillator indicated an oversold condition. How would you use this information along with the Parabolic SAR to make a trading decision? |
|---|
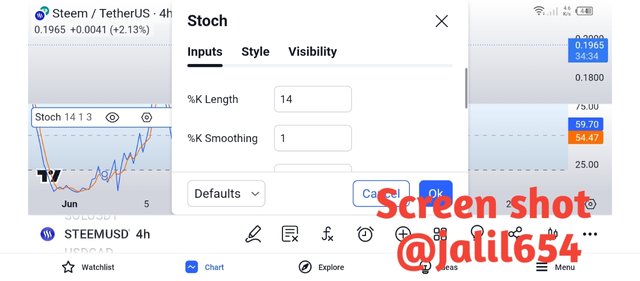
I applied both the indicators on STEEM/USDT pair in tradingview. The timeframe I choose is 1Day.
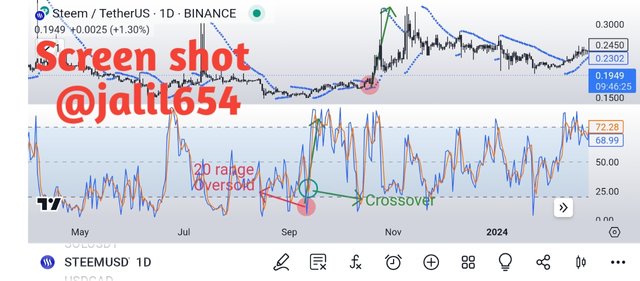
Stochastic Oscillator
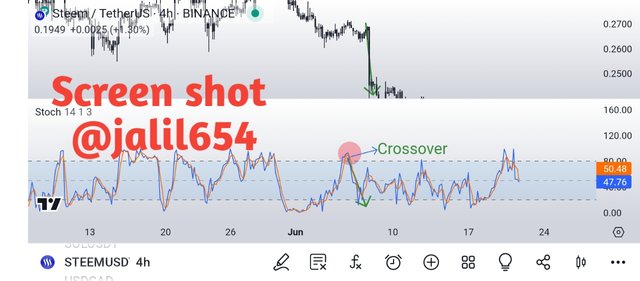
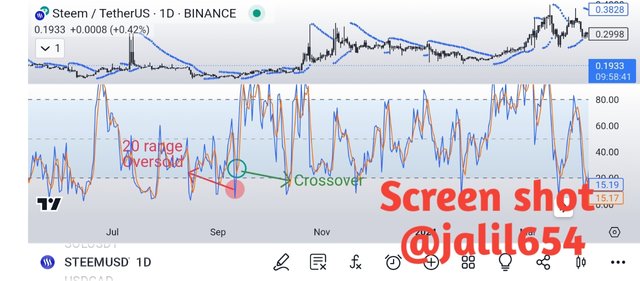
In the Red Circle, Stochastic Oscillator shows that the pair is in oversold region as it is below the 20 range. Additional, the %K line has crossover the %D line from below which is for further confluence.
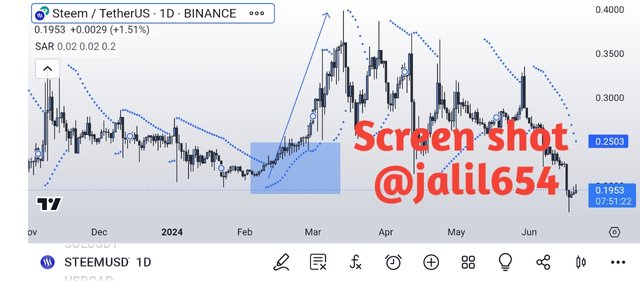
Parabolic SAR
The dots of Parabolic is close and is touching the price from below which means that the pair is on the support level.
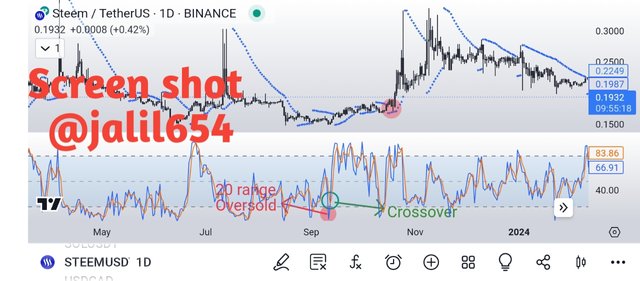
So we've the green and positive signal, and we saw an upward rally from there. The price move from 0.1650 to 3300.
Perform a technical analysis on the current STEEM/USDT pair using both the Stochastic Oscillator and Parabolic SAR. Based on your analysis, what would be your trading recommendation? |
|---|
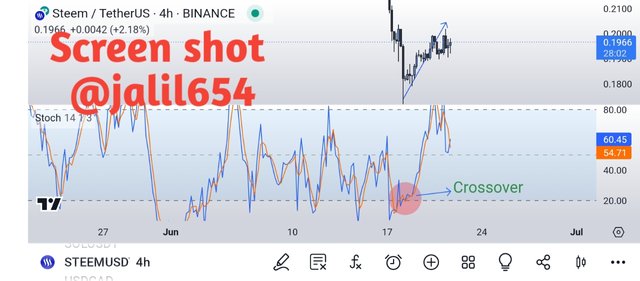
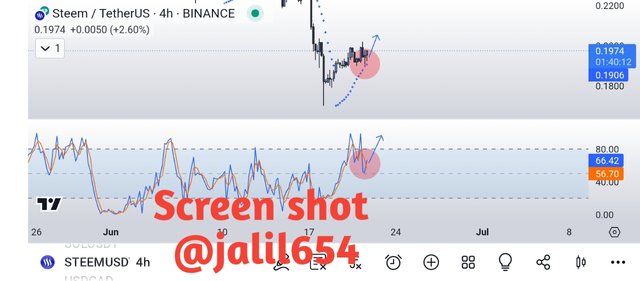
The current price of STEEM/USDT is consolidating. However we can take a long entry for a short period of time.
The Stochastic Oscillator is in 66 range which is not a good sign for buy but the %K line has crossover the %D line from below.
The parabolic SAR is on the support level as the dots are close to the price.
Therefore, We can take a long entry for short time. I'm analyzing the pair on 4H timeframe.
This is my own analysis and not a financial advice to anyone. Do your own Reach(DYOR).
My opinion is that the indicators didn't work always. And these two are lagging indicators which means that it follows the price action. So one needs to take as much confluences as possible. one again, I'm not a financial advisor, do you own reach before taking entry. And never be impressed from an influencer's indicators lines.

This all took me alot of my time, please support me. Thanks for being here!

inviting @cive40 , @willmer1988 ,and @waterjoe to take part in the contest.
Regards,
@jalil654
Unfortunately @jalil654, you are not eligible to participate in this competition, you must at least belong to club5050.
If we can use the two indicators properly and analyze them properly then it is very effective. Moreover it is very easy every trader uses it. Can find out their over buy and buying options very easily. Very well written. Wish you all the best