Steemit Crypto Academy | Season 3 - Week 5 || Market Patterns and Blockchain Projects
Background Image taken from Geospatialworld

In the previous class, corresponding to the third week of this third season of the academy, we had the opportunity to study part of the tools used by investors and analysts to predict trends in the cryptoasset market through the analysis of price data over a period of time, to identify patterns that allow, with a certain margin of confidence, to forecast the future behavior of the market.
On this occasion, the necessary steps for the development of new blockchain projects will be presented, from the drafting of the whitepaper as a technical document containing the fundamental guidelines, both technical and financial, of the nascent project, to capture the attention of future investors, as well as the roadmap that allows to capture the time lapses necessary for the execution of each of the stages of the project.
In 2017, numerous projects were presented to the community in search of financing, however, due to the lack of factual elements for their execution, they turned into frauds that meant the loss of substantial funds, so it is important to know all the aspects involved in order to avoid being a victim of a scam.
On the other hand, continuing with the tools for market analysis, there is a particularly useful one, known as "Japanese candlesticks", which originated among rice traders in Japan during the 18th century and was later transferred to the US stock market in the early 90s.

What are Blockchain Projects?
It has been just over a decade since the world witnessed the birth of the first and still today the most popular cryptocurrency, Bitcoin, and the exceptional functionalities of blockchain technology.
The word blockchain is often associated with Bitcoin, but this is only one of its many functions. Three of its benefits, and perhaps the most important, are the immutability, transparency and traceability of information, being very useful in many cases.
Thanks to these benefits offered by blockchain technology, a wide range of possibilities extends before us. From the creation of smart contracts, to specific applications by sector, among which we could mention, among others, the storage of academic records, digital certificates, electoral system, supply chain services, banking services, business accounting, control of medical records, up to virtual identification.
After many years of evolution, there are many blockchain project ideas in development, some of which have already attracted the attention of companies and investors around the world. Various decentralized applications can now be found for trading and accessing a wide range of functionalities with the available options.
However, many people might think that a wider availability of different blockchain-based projects, is a favorable factor. On the contrary, the massive portfolio of projects can be somewhat confusing for users. Do you want to opt for public blockchain projects that use Ethereum? Or do you want to use the functionalities of private blockchain projects that have a greater potential to revolutionize the landscape in the coming years?
Drawing up a list can help you get rid of all your confusions and make the right choice when it comes to blockchain project development.
Different Blockchain Networks to create tokens
For the issuance of tokens, it is not necessary to develop a blockchain, which is essential for a cryptocurrency, since tokens make use of an existing one. For example, Ethereum was originally created for smart contracts and later evolved into a currency.
Today, Ethereum is the most common platform for creating tokens, mainly due to its smart contracts feature, which they pioneered. Tokens created on the Ethereum blockchain are generally referred to as ERC-20 tokens, which include:
Chainlink (LINK)
Tether (USDT)
0x (ZRX)
Populous (PPT)
Maker (MKR)
IOStoken (IOST)
Status (SNT)
DigixDAO (DGD and DGX)
Loopring (LRC)
Basic Attention Token (BAT)
Another widely used platform for the creation of tokens is TRON Network, which through its smart contracts, allows developers to issue their own tokens under the TRC10 and mainly TRC20 standards.
Among the tokens created on TRON Network are:
TRON (TRX)
BitTorrent (BTT)
Just (JST)
ZIMBOCASH (ZASH)
TronEuropeRewardCoin (TERC)
Centric Cash (CNS)
SHD Cash (SHDC)
JUST Stablecoin (USDJ)
Whitepaper Concept
Whitepaper is one of the most necessary factors before considering to invest our funds in a certain project, the Whitepaper could be a document that seeks to elucidate in depth the operation, intentions, structure, development team, technologies used, current or future partners of the project under consideration. It also provides different details of information, such as, for example, the full range of tokens, their verbal form, distribution, administration, etc.
This manifesto is usually composed of technical language and is usually terribly concrete.
There are no various limitations to develop and publish a Whitepaper, that is why, many malicious agents take advantage of it to develop an unfeasible project or SCAM, i.e. a project intended to defraud unwary investors.
A Roadmap could be a chronogram for the design of a project, where the short, medium or long term objectives are represented, and the approximate lapses for the development of each one of those objectives are also attached, that is to say, it is a chronogram that shows the actions that will be carried out from the beginning until reaching each one of the objectives within the foreseen term.
The roadmap has among its various advantages the following: it allows to determine measurable objectives, to outline a launch date and, finally, it generates a form of realization or completion among potential investors.
It is usually organized into milestones or events, which correspond to the dates on which a cycle or a relevant part of the project is expected to be completed.
Japanese Candlestick Charting
This is a tool that contains data for various time frames on individual price bars. Candlesticks build patterns that predict price direction once completed.
Candlestick patterns are one of the most widely employed components of technical analysis, and are a visual representation of market price movements.
There are candlestick patterns that work with a high margin of confidence to predict the price trend. They are usually employed for daily, inter-day, weekly or monthly charts.
Although they first emerged in Japan during the 18th century for rice trading, since their introduction to the Western world in the 1990s by Steve Nison, their use has become popular, as they provide investors with information quickly from just a few price bars.
The expression, "candlesticks," refers to two different, but related, themes. First, and probably the best known, is the method of displaying information about securities for chart analysis. Second, it is the art of identifying certain known and previously tested candlestick combinations. Fortunately, both techniques can be used simultaneously or separately.
The information used to reflect the situation of a market by means of a candlestick chart is the one usually used for bar charts, i.e., opening, high, low and closing prices. Although they use exactly the same information, candlestick charts are visually more attractive, which facilitates their interpretation and analysis.
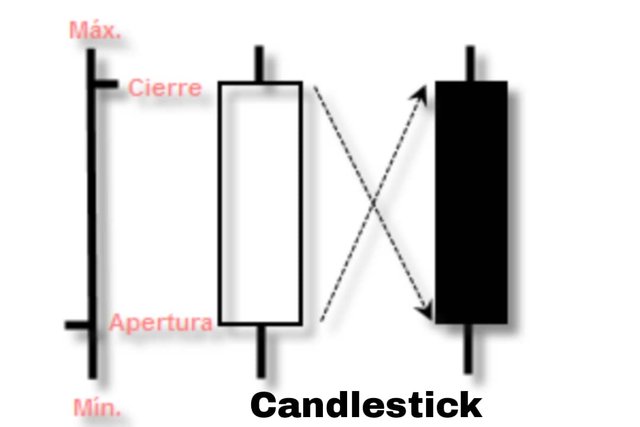
The rectangle, called the body, represents the difference between the opening and closing price for the same day. The body can be white or black, although they are often replaced by the colors green and red respectively.
A white or green body means that the closing price was higher than the opening price. Conversely, a black or red body means that the closing price was lower than the corresponding opening price.
The opening and closing prices have great importance in Japanese candlesticks. The small stripes or lines at the top and bottom of the body are known as wicks, hairs or shadows, and represent the highest and lowest prices of the day.
A candlestick pattern may consist of a single line or a combination of multiple lines, usually never more than five. Although almost all candlestick patterns are used to identify market turning or reversal points, there are some that are used to determine trend continuity. The former are called reversal patterns and the latter are called continuation patterns.
Upward patterns usually follow a downtrend in the market, and indicate a reversal in the direction in which prices are moving. They can be an indicator for investors to consider investing their funds in acquiring assets that would benefit from any upward trajectory.
Descending candlestick patterns usually form after an uptrend, and is a signal of a point of resistance. Often, great pessimism about the market price causes investors to shed their assets to take advantage of falling prices.
There are dozens of candlestick patterns, identified by colorful names that reflect Japanese culture. In 2008, American computer scientist and renowned trader, Thomas Bulkowski, edited "Encyclopedia of Candlestick Charts", a book where he examines 103 candlestick formations in depth, from guidelines for their identification and statistical analysis of their behavior, to detailed trading tactics.
Among the most common candlestick patterns, the following are included:
Three Line Strike
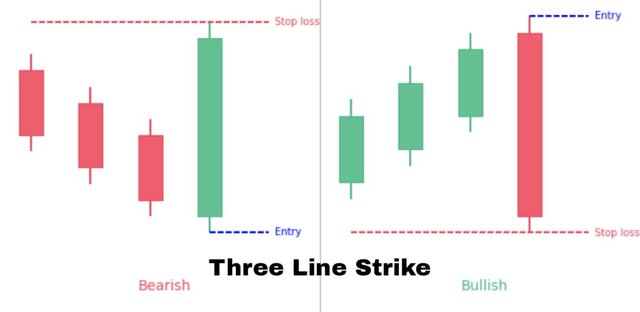
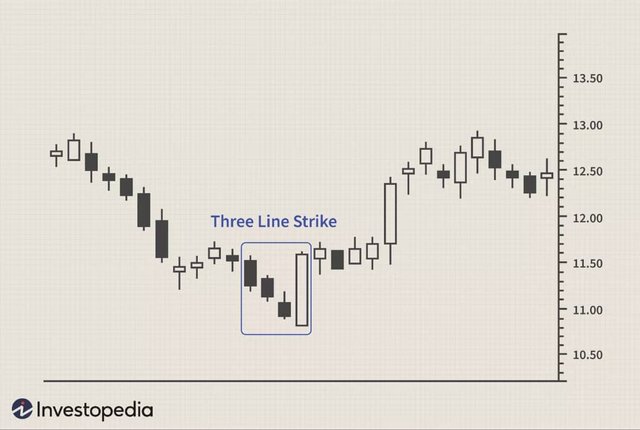
One of the most powerful reversal patterns is the Three Line Strike candlestick pattern, composed of 5 bars: three bars in the direction of a trend, followed by a final candlestick retracing back to the starting point. Investors use this pattern as an opportunity to buy at a current trend low or sell at a current high.
.jpeg)
The bullish formation is composed of a large green candlestick, 3 bullish candlesticks and a bearish candlestick that erases the advance made by the previous 3 candlesticks.
On the other hand, the bearish formation is composed of a large red candlestick, 3 descending candlesticks and an ascending candlestick that erases the decline made by the previous 3 candlesticks. According to Bulkowski, this reversal predicts higher prices with an accuracy rate of 83%.
.jpeg)
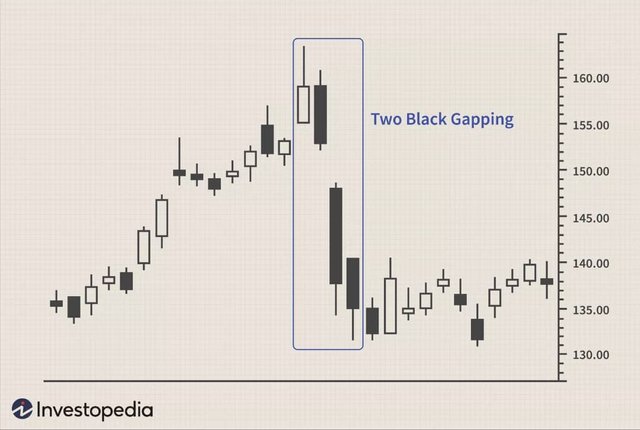
Two Black Gapping
The bearish Two Black Gapping continuation pattern appears after a notable high in an uptrend, with a downward gap producing two black(red) bars that record lower lows. This pattern predicts that the decline will continue to even lower lows, which could trigger a larger scale downtrend. According to Bulkowski, this pattern predicts lower prices with an accuracy rate of 68%.
.jpeg)
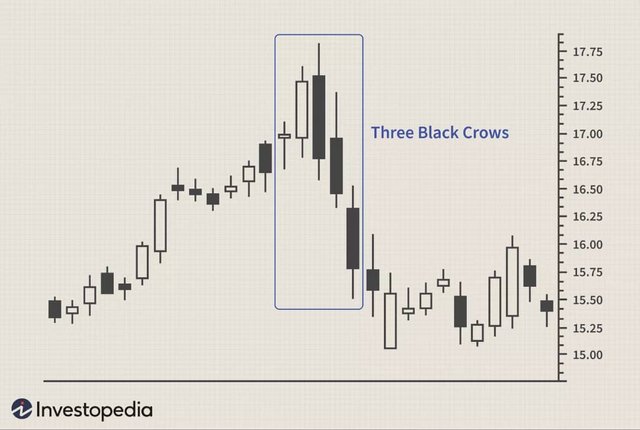
Three Black Crows
This pattern begins at or near the high of an uptrend, with three large black or red candlesticks with short or virtually non-existent wicks. Each session opens with a price similar to the previous day's price, but selling pressure causes the price to fall further and further at each close, potentially triggering a larger-scale downtrend.
Investors interpret these patterns as the beginning of a downtrend, as the number of sellers outnumber the number of buyers for three days in a row. According to Bulkowski, this pattern predicts lower prices with an accuracy rate of 78%.
.jpeg)
Homework Task.
1.) Choose at least 1 of the following cryptocurrencies.
- Axie Infinity AXS
- Chilliz CHZ
- Cardano ADA
- VeChain VET
Make an investment of $ 12 or more. Show screenshots of the process. Why did you choose this cryptocurrency? What is it Market Capitalization? What is it position in the cryptoasset rankings? What is the objective of the project behind this coin? Who founded this coin? Show the roadmap. What is the specific purpose of the cryptocurrency?
You can make your investment in another cryptocurrency, but you have to answer the same questions. (Currencies that are not allowed: TRON, Steem, SBD, Bitcoin, Ethereum or any stablecoin)
2.) Explain in your own words what the "Evening Star" pattern consists of. What is its hit rate?
3.) Explain in your own words what the pattern "Abandoned Baby" consists of. What is the percentage correct?
4.) Perform analysis for 3 and 7 recent calendar days for Bitcoin Do you identify any patterns? Show screenshots
The graphs you use must have your Steemit username.
Guidelines
(1) Your article should be at least 300 words.
(2) This homework task expires Saturday, July 31 at 23:59 UTC (7:59 pm Venezuelan Standard Time)
(3) Eligibility Criteria--
- Must have a reputation of 55 or above
- Must have at least 250 SP (excluding any SP delegated-in)
(4) Add tag #imagen-s3week5 and #cryptoacademy in your post and should be among the first five tags. And also make sure you post in the Steemit Crypto Academy community.
PLAGIARISM AND SPAM WILL NOT BE TOLERATED
Use copyright-free images or indicate the original source


Nice work! You just got yourself a $2.35 upvote. Enjoy! Check us out at acom.uno or swing by for a chat at ACOM Discord
Hola Profesor @imagen. Aquí le dejo el enlace de mi asignación:
https://steemit.com/hive-108451/@manuelgil64/steemit-crypto-academy-season-3-week-5-or-or-patrones-de-mercado-and-proyectos-blockchain-por-imagen
Profesor la inversión es obligatoria? de ser así de cuanto es lo mínimo?
Si. Monto minimo de inversion equivalente a $12 o mas.
Por que específicamente 12 si con 10 se puede realizar en binance, es el mínimo estándar.
Hey professor @imagen, I have just done a fundamental analysis on Cardano that includes all the details and I have also made an investment of $10 in Cardano for previous week homework.
So can I use them in this homework?
No lo puedes utilizar. Debes realizar una nueva inversion en Cardano o en cualquier moneda de tu preferencia.
Buenos dias profesor, podria ser una inversion con dinero virtual?
Profe @imagen, y tengo otra pregunta, el analisis de las graficas de BTC de 3 y 7 dias, deben ser una de 3 días y la otra de 7 días? O puedo escoger entre 3 y 7 días?
¿y puedo hacerlas con la vista gráfica de 4H?
Debes realizar 2 analisis: uno a 3 dias y el otro a 7 dias. Si puedes realizarlo con un marco de 4 hrs sin problemas.
Cuando te refieres a dinero virtual, estas hablando de PayPal o alguna otra plataforma similar? Lo que solicito es realizar una inversion (compra, cambio o staking de monedas) y mostrar las capturas de pantalla y describir brevemente el proceso, las criptos las puedes obtener del modo que creas conveniente o emplear tus fondos en la wallet que usas con frecuencia.
Nadie puede ignorar o negar la importancia y la tasa de crecimiento de las criptomonedas en esta era. El bitcoin sin duda es el primer activo y el más valorado
Buenas noches profesor estado realizando la tarea, pero tengo una gran duda. En la pregunta numero 3 y numero 4 se me a dificultado el tema de los porcentajes de acierto.
Por mas que investigo es muy difícil saber su porcentaje.
Thomas Bulkowski da porcentajes de acierto para los mas de 100 patrones que estudio. Tambien hay otros autores que hablan de estos porcentajes, aunque difieren de Bulkowski.
Gracias profesor ya fui a su libro para poder conseguir una información detallada, gracias por responder mi duda.
Could you give some more details for question 4?
Will we find patterns for that have formed in the last 3 working days (July 27,26,25) and the last 7 working days (July 27,26,25,24,23,22,21)?
Should these patterns be "Evening Star", "Abandoned Baby", "Three Black Crows", "Two Black Gapping" and "Three Line Attack"?
Hi professor... here is my assignment link link
I noticed you skipped me😔
Thank you @imagen for your nice lecture. Kindly see my entry link below.
https://steemit.com/hive-108451/@benton3/4p52ze-crypto-academy-season-3-week-5-homework-post-for-image-by-benton3.
Here is my homework
https://steemit.com/hive-108451/@olaspecial/steemit-crypto-academy-or-season-3-or-week-5-or-market-patterns-and-blockchain-projects-or-for-professor-imagen