Technical Indicators Part 2 - Crypto Academy / S4W4 - Homework Post for Professor @reminiscence01
Assalamualaikum and good evening everyone, welcome to the Steemit Crypto Academy season 4. Tonight I will write a post about Technical Indicators as homework for professor @reminiscence01 and this is my fifth post in this season. The professor has explained about the Technical Indicators Part 2 in the learning post that has been shared with this community and now it's time for students to complete the homework that has been given, there are six main questions that must be answered in this homework and I will try to answer them in this post. Let’s go...

Q1.) Explain Leading and Lagging indicators in detail. Also, give examples of each of them
A. Leading Indicators
Leading Indicators are indicators that can give traders an early signal so that traders can enter the market at the right time and traders can minimize the size of their stop-loss because these indicators can describe the market price movement before the actual movement occurs so that traders can catch all price movements that will occur before it actually happens.
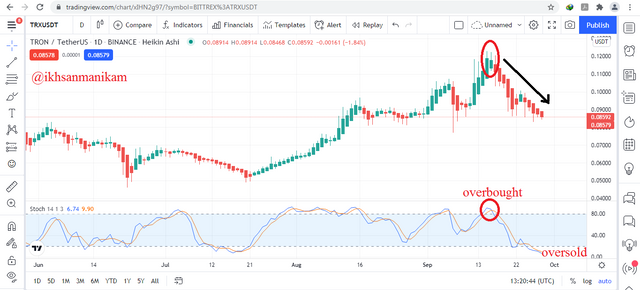
As seen in the picture above, Leading indicators can help traders to describe price movements in the future based on Overbought and Oversold conditions because usually the market price will experience a reversal after these two conditions so that traders can prepare the right strategy before entering the market. On the price chart I use the Stochastic indicator to determine Overbought and Oversold conditions, the Overbought zone is above 80 while the Oversold zone is below 20.
But in some cases and as seen in the picture above, sometimes the indicators give false signals which can cause traders to get lost and lose or not be able to maximize profits, this generally happens in the case of a strong trend. The retracement that occurred in this case is fake because the price managed to resume its trend. Therefore, traders should use Leading indicators in Sideways market conditions because they tend to work better in these conditions and by considering the use of a longer timeframe of course because using a longer timeframe can minimize the potential for false signals. To get good analytical results, traders also need to combine several other technical indicators according to their needs and trading strategies.
B. Lagging Indicators
Lagging Indicators are indicators that can provide signals with better accuracy because signals about the start of a trend will be identified when a trend has started because these indicators move behind the actual price movement so as to minimize false signals. Although they can minimize the potential for false signals, these indicators can sometimes cause traders to lose momentum and enter at the wrong point because the trend is ongoing and sometimes in some cases traders have to lose because the trend weakens and does not continue its movement anymore. In this case, sometimes traders must also have a stop-loss with a wider size.
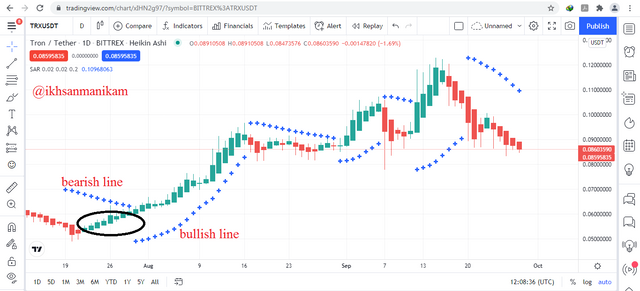
As seen in the picture above, Lagging indicators can help traders to identify a trend that is happening in the market so that traders can prepare the right strategy before entering the market. On the price chart I use the Parabolic SAR indicator to identify a trend, when the Parabolic SAR dots are seen moving at the bottom of the candlesticks it is considered an uptrend and when the Parabolic SAR is seen moving at the top of the candlesticks it is considered a downtrend.
Lagging indicators like this are also more suitable for Swing Trading cases because they need to consider long-term trends. Lagging indicators can also be used as confirmation tools to confirm a trend. To get good analytical results, traders also need to combine several other technical indicators according to their needs and trading strategies.
Q2.) With relevant screenshots from your chart, give a technical explanation of the market reaction on any of the examples given in question 1. Do this for both leading and lagging indicators
Based on the Price Chart image above, it can be seen that the TRX/USDT trading pair with 1 Day timeframe was overbought two weeks ago and then the price started moving downwards to form a downtrend formation until the price was in the Oversold zone for now.
The Stochastic indicator in this case works well as a Leading Indicator because it manages to show Overbought and Oversold signals according to the actual price movement so that experienced traders can place their orders at the right time, Overbought can be said to be the best selling zone because the price has the potential to become bearish after this condition while Oversold can be said to be the best buy zone because the price has the potential to become bullish after this condition. Based on the picture, it can be seen that the TRX/USDT trading pair is currently in Oversold condition, this indicates that traders can enter the market by placing Buy Orders and still using stop-loss of course.
Based on the zones that I have marked in the Price Chart image above, it can be seen that the Parabolic SAR indicator on the TRX/USDT trading pair with 1 Day timeframe shows its late signal or is referred to as the Lagging Indicator, the Parabolic SAR has just shown a Bullish signal when the uptrend phase has entered the seventh candle or a week later.
Based on that case, if traders only use these signals then traders have lost momentum to enter the market early because the indicator gave late signals and therefore traders should enter the market by placing a Buy Order which has a wider stop-loss size because the price is in a trend and not at the beginning of the trend anymore. But this signal can still be considered as one of the results of the analysis of course.
Q3.) What are the factors to consider when using an indicator?

A. Understanding your Trading Strategy
This is the main factor to understand and consider as it is the starting point of your trade. There are hundreds of technical indicators out there and every trader needs to understand the trading strategy that will be executed so that traders can choose the technical indicator according to their needs and based on their compatibility with the trading strategy that will be executed. In many cases, Swing trading generally uses a relatively longer timeframe & analysis period while Scalping trading usually only considers a relatively shorter timeframe & analysis period and then chooses the appropriate technical indicators of course.
B. Understand the Market Trend
Identifying the market trend properly is an important consideration in any trade that traders make because trading against the trend is ridiculous. To be sure, when the market is in a trend, traders can use various trend-based indicators to identify the strength of a trend and when the market is sideways, traders can use various momentum or volatility-based indicators to identify Overbought and Oversold so that traders can get maximum profit.
C. Understand the type of Indicator
In its use, traders also need to understand well the types of indicators that will be used because this can affect trading decisions and trading management that will be applied. Traders must understand whether the indicator is Leading or Lagging, Leading indicators tend to move in front of the price while Lagging indicators tend to move behind the price and to avoid false signals so traders can confirm it first by using other technical indicators according to the strategy and trading needs being carried out.
D. Finding Confluences
To get better analysis results and avoid various false signals, traders need to confirm a signal by combining several technical indicators and technical tools. When several indicators tend to show the same signal then the signal can be confirmed as an analysis result even if it is not 100% accurate. For example, to ensure that the Sharkfin Pattern formed in the market can be considered as a good analysis result or not, traders need to confirm it with various momentum-based indicators such as RSI (Relative Strength Index), while the combination that I often use is a combination of ADX, KDJ, and, ATR. Traders can also use various other technical combinations according to the needs of the trading strategy being carried out.
Q4.) Explain confluence in cryptocurrency trading. Pick a cryptocurrency pair of your choice and analyze the crypto pair using a confluence of any technical indicator and other technical analysis tools. (Screenshot of your chart is required)
In order to avoid various false signals and to get better analysis results, traders need to confirm a signal by combining several technical indicators and when several indicators tend to show the same signal then the signal can be confirmed as an analysis result and vice versa. But in this question, I will not use the combination of ADX, KDJ, and ATR that I often use because I will try to use a combination of Stochastic, Parabolic SAR, and KDJ. Traders can also use various other technical combinations according to the needs of the trading strategy being carried out.
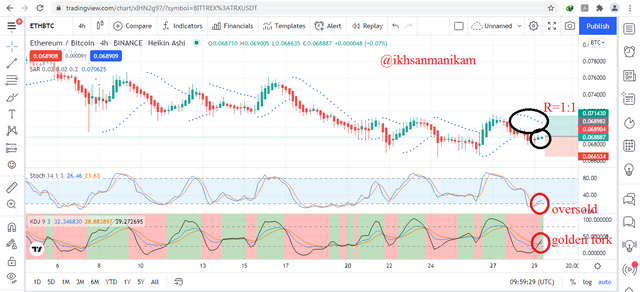
Based on the Price Chart image above, overall it can be seen that the ETH/BTC trading pair with 4 Hour timeframe is currently in a downtrend phase. To confirm analysis signal and get better analysis results, I will use a combination of three indicators, namely Stochastic, Parabolic SAR, and KDJ.
Based on the picture, it can be seen that currently the Stochastic indicator shows the price of ETH/BTC is in the Oversold zone after reaching the Overbought zone two weeks ago and this is an entry signal for traders to placing Buy Orders, the Parabolic SAR indicator also shows that the market is currently in in a bearish condition so that a potential trend reversal may occur. But in this case I only consider Parabolic SAR as a supporting indicator because this indicator is lagging while I always want to enter the market at the beginning of the trend. To strengthen my analysis, I also saw signs of a trend reversal due to the appearance of two bullish candles.
To confirm it, then next I will consider the signals that will be given by the KDJ indicator. Based on the picture above, it can be seen that the KDJ indicator shows that the ETH/BTC trading pair has just exited the Oversold zone and has just formed a Golden Fork which is a strong indication that the market will reverse direction from Bearish to Bullish. After that, I can conclude that the results of my analysis prompted me to make a decision to enter the market and place a Buy Order using a 1:1 stop-loss ratio as a good trade management and prevent losses if the results of my analysis go in the opposite direction because no analysis results are 100% accurate.
Q5.) Explain how you can filter false signals from an indicator
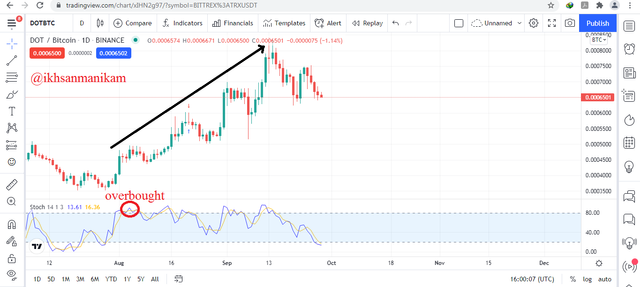
Sometimes indicators do not provide valid signals for traders because in some cases traders feel cheated when they see the market moving in the opposite direction from the signal given and this usually happens in a strong market trend. As seen in the picture above, the Stochastic indicator has shown Overbought with a value above 80 which indicates that the market has the potential to reverse direction, but in fact the market is still continuing its trend.
Therefore, traders need to filter out these false signals by ensuring that the current price movement is going in the same direction as the indicated signal and then traders can confirm it using the help of other technical indicators that are considered suitable for the current trading strategy.
Q6.) Explain your understanding of divergences and how they can help in making a good trading decision. Using relevant screenshots and an indicator of your choice, explain bullish and bearish divergences on any cryptocurrency pair
Divergences are phenomena that show a difference between price movements and visual readings contained in the indicator and these phenomena tend to go in the opposite direction, both in the case of Bearish and Bullish.
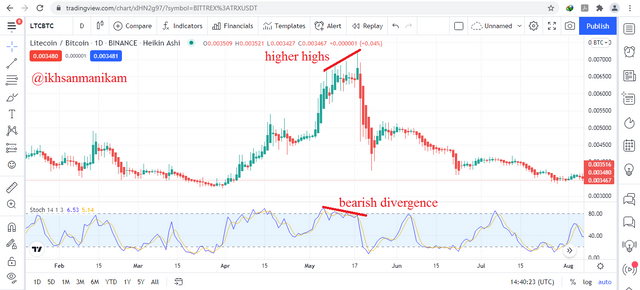
Using the Stochastic indicator, the picture above shows the case of Bearish Divergence from the Stochastic indicator because the indicator shows a lower low formation condition while price movement shows a higher highs formation. The lower low formation can indicate that the Bullish trend is starting to weaken and has the potential for a price reversal. Based on the picture it can be seen that the price reversal actually occurred and then the market changed from Bullish to Bearish. In this case, traders should place Sell Orders to take some profit because the price has the potential to fall after this phenomenon occurs.
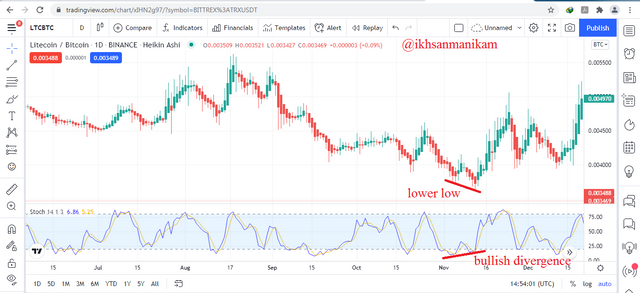
By using the Stochastic indicator, I also want to show the case of the Bullish Divergences of the Stochastic indicator. Based on the picture above, it can be seen that the Stochastic indicator shows a lower high formation while price movement shows a lower low. The lower high formation can indicate an uptrend while the lower low formation indicates a downtrend. It can also indicate that the downtrend may be ending and a potential price reversal may occur. Based on the picture it can be seen that the price reversal actually occurred and then the market changed from Bearish to Bullish. In this case, traders should place Buy Order to take some profit in the future because the price has the potential to rise after this phenomenon occurs.
From the two types of divergences, it can be concluded that in fact the phenomenon of divergences can also be used to filter out false signals from indicators and detect potential price reversals at an early stage, but some traders only consider this phenomenon as a false signal. Therefore, traders also need to understand the market formation well and always consider signals from other technical indicators to support better analysis results and if you have decided then don't forget to always use stop-loss because no analysis is 100% accurate and sometimes the market moves in the opposite direction.
Technical analysis is the main choice for some traders in making trade analysis and technical indicators play an important role in this case because traders can maximize profits and minimize losses if they can do the analysis well.
Selection of good indicators and in accordance with the trading strategy being carried out can also result in better analytical decisions. Traders also need to combine several technical indicators to confirm whether a signal can be said to be a considered analytical decision or not. However, technical indicators cannot provide 100% accurate signals so traders always need to use stop-loss in every trade they make.
Hello @ikhsanmanikam, I’m glad you participated in the 4th week Season 4 of the Beginner’s class at the Steemit Crypto Academy. Your grades in this task are as follows:
Observations:
That's true. Traders who use leading indicators always fall for market manipulations and fakeouts.
Recommendation / Feedback:
Thank you for participating in this homework task.