Steemit Crypto Academy Season 3 Week 8 | Homework Post for Professor @cryptokraze - Sharkfin Pattern

Good evening everyone, today I will continue my writing activities in the Steemit Crypto Academy community and this is the last week of Season 3. I will take a class given by professor @cryptokraze and the topic discussed in this class is about "Sharkfin Pattern", very interesting of course because this is a new learning for me. Let's discuss it by trying to complete the homework given by the professor and there are four main questions that must be answered in this homework, let’s start...

Q1.) What is your understanding of Sharkfin Patterns. Give Examples (Clear Charts Needed)
There are various Candlestick Patterns that appear in the market and this is one indication that traders can use to identify the market in addition to using technical indicators. Therefore, traders also need to understand the various Candlestick Patterns that often appear in the market and one of them that we will discuss this time is the Sharkfin Pattern.
The cryptocurrency market is always volatile so the formation of Candlesticks is also constantly changing. Sometimes the market moves quickly and then reverses direction quickly too so that the candlesticks contained in the market tend to form a formation similar to the letter "V" or inverted "V" and this reversal condition is known as the Sharkfin Pattern. By observing this pattern, traders can see the potential for a trend reversal and this pattern can be considered as part of technical analysis, to confirm the trend reversal more accurately, traders can also combine it with readings from certain indicators.
Sharkfin Pattern like “V” Formation on Downtrend Market
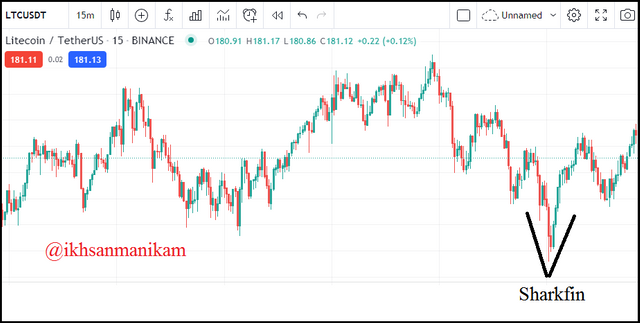
Based on the picture, it can be seen that the Sharkfin Pattern that occurs in the Downtrend has a formation that looks like the letter "V" and this is a signal for the starting point of the trend reversal from Downtrend to Uptrend.
In this condition, there is a shift in dominance between sellers and buyers in a short period of time, sellers succeed in dominating the market to push prices lower until they reach the support point because the amount of supply is more than the number of demand, but after that the sellers fail to maintain their dominance so that the buyers succeed take over market dominance to push prices higher because the number of demand is more than the number of supply, finally the price moves back up and then the market conditions change to an Uptrend.
Sharkfin Pattern like Inverted “V” on Uptrend Market
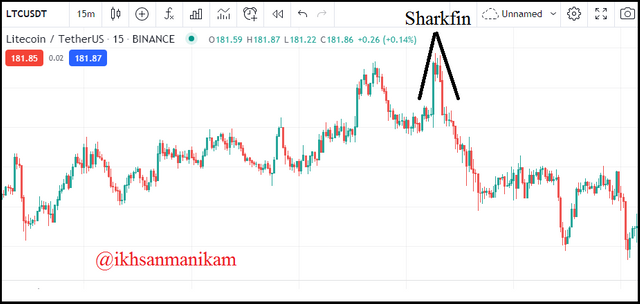
Based on the picture, it can be seen that the Sharkfin Pattern that occurs in the Uptrend has a formation that looks like an inverted "V" and this is a signals for the starting point of the trend reversal from Uptrend to Downtrend.
In this conditions, there is a shift in dominance between sellers and buyers in a short period of time, buyers managed to dominate the market to push prices higher until they reached the resistance point because the number of demand was greater than the number of supply, but after that the buyers failed to maintain their dominance so that the sellers succeeded take over market dominance to push prices lower because the amount of supply is more than the number of demand, finally the price moves back down and then the market conditions change to a downtrend.
Q2.) Implement RSI indicator to spot sharkfin patterns. (Clear Charts Needed)
RSI or Relative Strength Index is one indicator that is relied on by a number of traders. This indicator serves to determine overbought and oversold conditions in a market. Support levels and resistance levels are identified based on the overbought and oversold conditions, the support level can be said to be oversold while the resistance level can be said to be overbought. Both conditions are described based on a range of values 1-100, with details that 0-30 is said to be oversold while 70-100 is said to be overbought. While the best period settings that are generally used by traders on this indicator are 14 periods and this is also the default mode of this indicator.
Based on the philosophy, I think the Sharkfin Pattern is very suitable to be combined with the RSI, with this combination traders can determine whether the Sharkfin formed in a market is at the support/oversold level or at the resistance/overbougt level because trend reversals are more likely to occur in both conditions. That way traders can make decisions in a better way, if Sharkfin is formed at an overbought/resistance level then traders can consider placing a sell order while if Sharkfin is formed at an oversold condition/support level then traders can consider placing a buy order and traders should do not operate a trade on Sharkfin formed outside of these two conditions (in the 30-70 range) because it cannot be confirmed by the RSI and may not have much potential for a trend reversal.
Sharkfin Pattern like “V” Formation on Downtrend Market with RSI Confirm
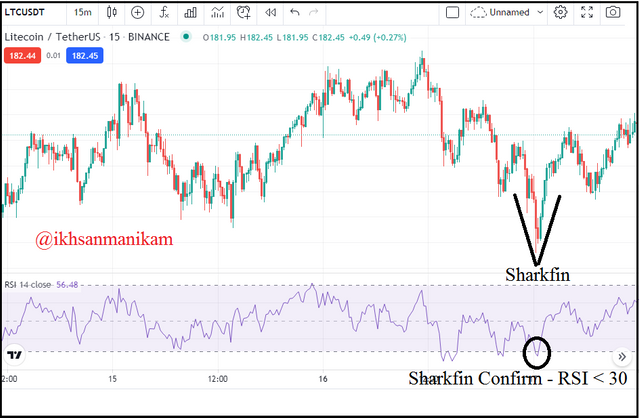
Based on the picture, it can be seen that the Sharkfin Pattern that occurs in the Downtrend has a formation that looks like the letter "V" and this is a signal for the starting point of the trend reversal from Downtrend to Uptrend. To confirm it, traders can use the RSI function in this case. This trend reversal from Downtrend to Uptrend will be confirmed as a strong signal if the value of the RSI line manages to break through the oversold level which is below 30 and then rises again quickly to reverse its position as shown in the picture, and this shows that the market has great strength to not want to sink for longer, then the market turns into an Uptrend.
Sharkfin Pattern like Inverted “V” on Uptrend Market with RSI Confirm
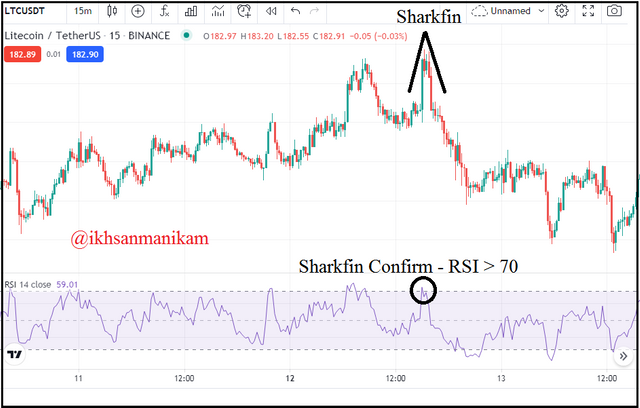
Based on the picture, it can be seen that the Sharkfin Pattern that occurs in the Uptrend has a formation that looks like an inverted "V" and this is signals for the starting point of the trend reversal from Uptrend to Downtrend. To confirm it, traders can use the RSI function in this case. This trend reversal from Uptrend to Downtrend will be confirmed as a strong signal if the value of the RSI line manages to break through the overbought level which is above 70 and then drops back quickly to reverse its position as shown in the picture, and this shows that the market not has big strength to maintain the euphoria longer, then the market turns into a Downtrend.
Q3.) Write the trade entry and exit criteria to trade sharkfin pattern (Clear Charts Needed)
Trade entry criteria to trade sharkfin pattern
a. Entry criteria to Buy
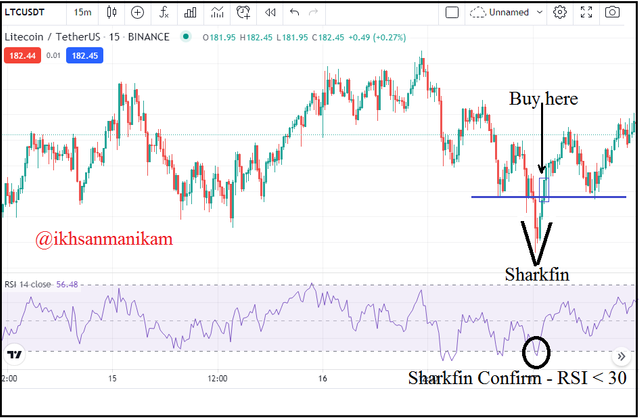
There are several things to note as in the picture. Make sure you have added the RSI indicator to the chart with the default settings, namely 14 periods with a lower limit of 30 and an upper limit of 70 as oversold and overbought parameters. Then visually identify a number of charts to find the Sharkfin “V” Formation in a number of downtrend markets. After finding it, then visually identify whether the value of the RSI line managed to break through the oversold level which was below 30 and then quickly rise back above 30 to reverse its position, and if so, you can enter the market to place a Buy order. Make sure you place the Buy order when the value of the RSI line is really above the number 30.
b. Entry criteria to Sell
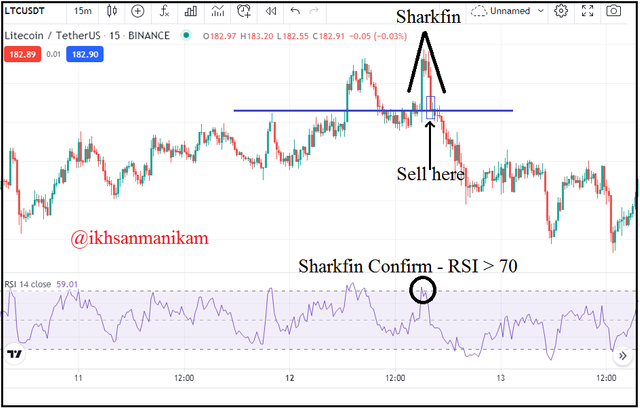
There are several things to note as in the picture. Make sure you have added the RSI indicator to the chart with the default settings, namely 14 periods with a lower limit of 30 and an upper limit of 70 as oversold and overbought parameters. Then visually identify a number of charts to find the Sharkfin Inverted “V” in a number of uptrend markets. After finding it, then visually identify whether the value of the RSI line managed to break through the overbought level which was above the 70 and then drop back beyond the 70 quickly to reverse its position, and if so, then you can enter the market to place a Sell order. Make sure you place the Sell order when the value of the RSI line is really below 70.
Trade exit criteria to trade sharkfin pattern
a. Exit criteria to Buy
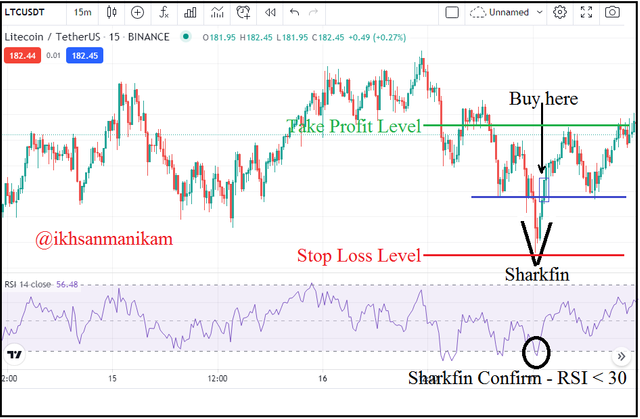
Setting a stop loss is one of the most important things in trading because the market can change at any time and can move in the wrong direction, including in this case. In this case traders can set the stop loss by placing it below the turning point in the Sharkfin “V” Formation. In addition to stop loss, traders also need to set take profit with a minimum risk reward ratio of 1:1 as shown in the picture.
b. Exit criteria to Sell
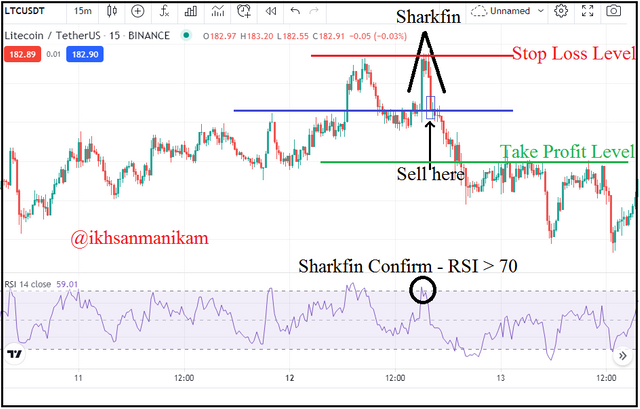
Setting a stop loss is one of the most important things in trading because the market can change at any time and can move in the wrong direction, including in this case. In this case traders can set a stop loss by placing it above the turning point of the Sharkfin Inverted “V”. In addition to stop loss, traders also need to set take profit with a minimum risk reward ratio of 1:1 as shown in the picture.
Q4.) Place at least 2 trades based on sharkfin pattern strategy (Need to actually place trades in demo account along with Clear Charts)
In this section, I will demonstrate two different trading simulations, one based on the Sharkfin Pattern like “V” Formation and Sharkfin Pattern like Inverted “V” using the DOT/BTC and FTT/BTC trading pairs. Let's see it.
DOT/BTC
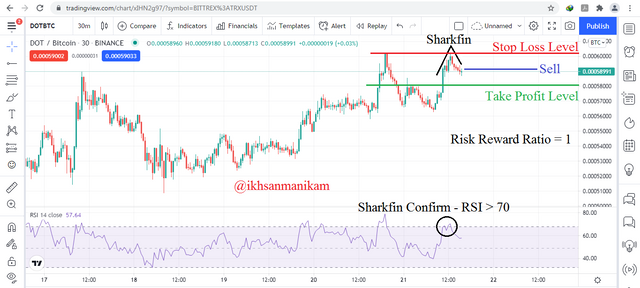
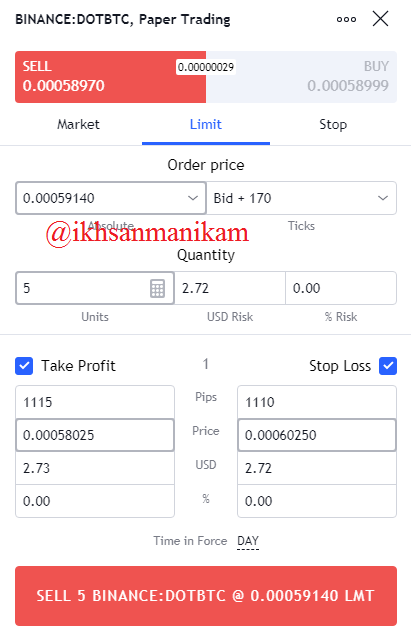
Based on the picture, it can be seen that the Sharkfin Pattern like Inverted “V” has just been formed and confirmed by the value of the RSI line which had crossed the overbought zone above 70. That way I will place a Sell order in this trade. Before placing a sell order, I first made sure that the RSI value was actually below 70. I set my stop loss at 0.00060250 and take profit at 0.00058025, while the order price was 0.00059140. The risk reward ratio that I use in this case is 1:1.
FTT/BTC
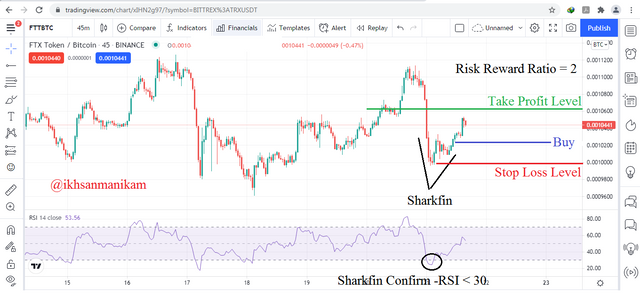
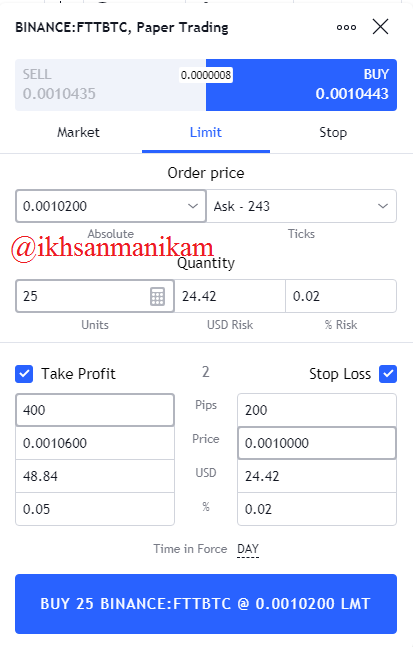
Based on the picture, it can be seen that the Sharkfin Pattern like “V” Formation has just been formed and confirmed by the value of the RSI line which had crossed the oversold zone below 30. That way I will place a Buy order in this trade. Before placing a Buy order, I first made sure that the RSI value was actually above 30. I set my stop loss at 0.00100 and take profit at 0.00106, while the order price was 0.00102. The risk reward ratio that I use in this case is 1:2.
Candlestick formations continue to change in the crypto market which indicates that the crypto market is volatile and sometimes the market moves quickly and then reverses direction quickly so that the candlesticks in the market tend to form a formation similar to the letter "V" or inverted "V" identified as Sharkfin Pattern. By observing this pattern and combining it with a number of readings from other indicators such as the RSI, ADX and MA, traders can see the potential for a trend reversal in the market and confirm the trend reversal more accurately even if it is not 100%. Traders also need to use a good stop loss setting according to the strategy being implemented, the minimum risk reward ratio is 1:1.