Steemit Crypto Academy Season 3 Week 8 | Homework Post for Professor @asaj - Crypto Assets and the Random Index (KDJ)
Good morning everyone, today I will continue my writing activities in the Steemit Crypto Academy community and this is the last week of Season 3. I will take a class given by professor @asaj and the topic discussed in this class is "Crypto Assets and the Random Index (KDJ)”, is very interesting of course because this is a new lesson for me. Let's discuss it by trying to complete the homework given by the professor and there are five main questions that must be answered in this homework, let’s start...

Q1.) Define the random index in your own words and explain how it is calculated
About KDJ Indicator (Random Index)
It is difficult to find a truly reliable indicator because of the random nature of price movements. One way to predict the market is by conducting technical analysis using various indicators and in this case the KDJ Indicator which is also often referred to as the Random Index Indicator. The main purpose of using this indicator is to identify market price movements and trend reversals so that traders can determine more precise entry and exit points of course by looking at Buy Signals and Sell Signals.
This indicator is more suitable for use on trending markets and is not suitable for use on flat markets that are not wavy or called sideways because potentially give false signals. In using this indicator, you also need to consider using long timeframes chart analysis because short timeframes chart analysis can also potentially give false signals. False signals are one of the things that traders are very wary of because it can lead traders to take wrong decisions so that they get stuck in bad market conditions and end up having to leave the market with some losses.
There are three main lines that need to be known on this indicator, namely K-line, D-line, and J-line. This indicator is one of the indicators developed based on the principle of the stochastic oscillator and what distinguishes it is the addition of the J-line which aims to illustrate the divergence of the D-line from the K-line. In addition, this indicator is also considered similar to three other indicators, namely the Alligator Indicator, Commodity Channel Index (CCI), and Vortex Indicator.
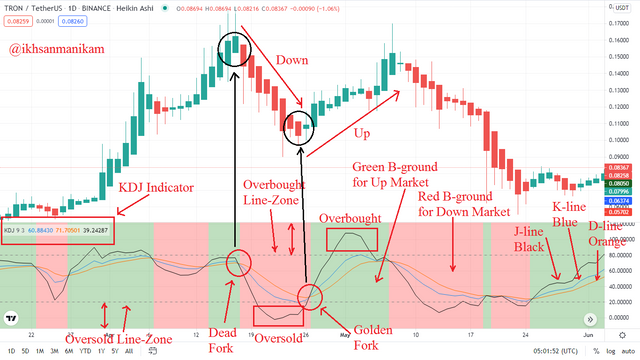
By using the KDJ Indicator, traders can identify whether the market conditions are Uptrend or Downtrend and whether the market conditions are Overbought or Oversold, and the three lines play an important role in this. When the market is Uptrend, the J-line is above the K-line and D-line while when the market is Downtrend the J-line is below the K-line and D-line so traders will usually monitor the "cross-spot" of these three lines because this can be a signal that may have the potential for a trend reversal. In the case of the starting point of the Uptrend, the cross-spot will be referred to as the “Golden-Fork” while at the starting point of the Downtrend it will be referred to as the “Dead-Fork”.
When the three lines cross which makes the J-line above the K-line and D-line then traders will identify it as a buy signal because of the potential for an Uptrend, while when the three lines cross which makes the J-line below the K-line and D -line then traders will identify it as a sell signal because of the potential for a downtrend. The color that appears on the background of the indicator can also indicate the market trend, the green color indicates that the market is Uptrend while the red color indicates that the market is Downtrend.
Using this indicator, traders can also identify Overbought and Oversold conditions based on the 1-100 value range, especially on the J-line. When the indicator shows the J-line value is above 80 then traders will identify it as an Overbought condition and when the indicator shows the J-line value is below 20 then traders will identify it as an Oversold condition. Overbought conditions are the best selling point, while Oversold conditions are the best buying points. In addition, the golden-fork can also be identified as the best buying point while the dead-fork can also be identified as the best selling point.
How to Calculate KDJ Indicator (Random Index) with Example Case LINK/USDT
To calculate it is not difficult and you only need to follow a few simple steps, for easy understanding I will demonstrate it using the actual case of the LINK/USDT trading pair. Let's see the following tutorial.
- Firstly, determine below prices
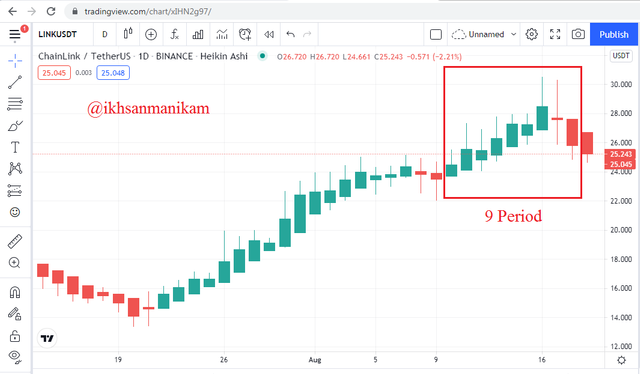
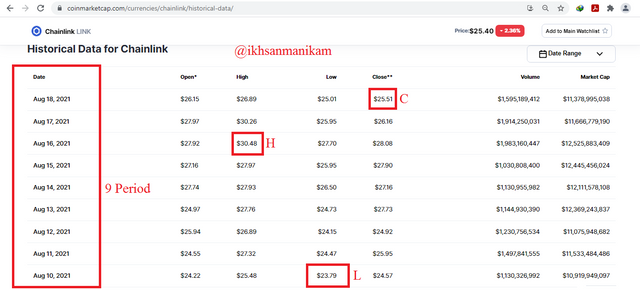
Based the chart,
H = Highest price of a certain period = $ 30.48
L = Lowest price of a certain period = $ 23.79
C = Close price of the day = $ 25.51
In this case I will use n Period as 9 Period
- Second, determine Reserve Value of the day
RSV of the day = [(C-L) / (H-L)] x 100
= [(25.51 – 23.79) / (30.48 – 23.79)] x 100 = 25.71
- Next, calculate K and D value of the day
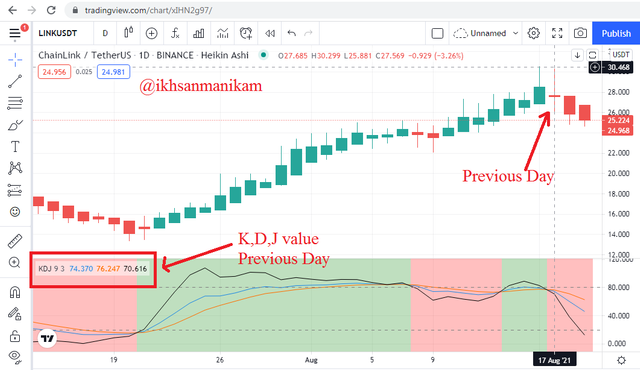
Based the chart, K value previous day is 74.370 and D value previous day is 76.247
K value of the day = [(2/3) x K value previous day] + [(1/3) x RSV of the day]
= [(2/3) x 74.37] + [(1/3) x 25.71] = 58.15
D value of the day = [(2/3) x D value previous day] + [(1/3) x K value of the day]
= [(2/3) x 76.247] + [(1/3) x 58.15] = 70.21
- Finally, calculate J value of the day
J value of the day = 3 x K value of the day – 2 x D value of the day
= 3 x 58.15 – 2 x 70.21 = 34.03
So, the result for K, D, J of the day is 58.15, 70.21, 34.03
Result Comparison
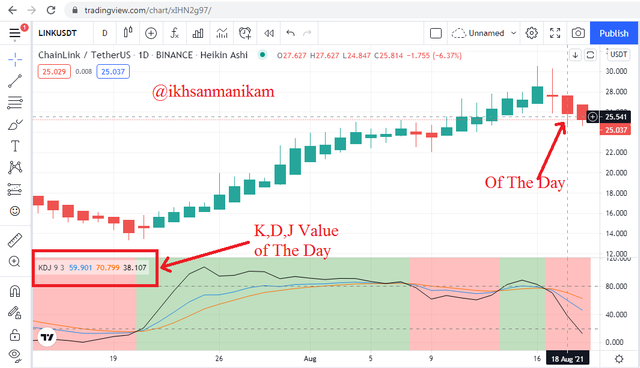
Based the chart, the K, D, J value actual is 59.901, 70.799, 38.107 while K, D, J value based my calculation is 58.15, 70.21, 34.03. Based on this comparison, it can be said that the results of my calculations are not too far from the actual conditions and this proves that my calculations are almost accurate, with accuracy reaching 90%.
Q2.) Is the random index reliable? Explain

The reliability of an indicator can be said to be a relative thing and depends on how the trading strategies and methods are carried out by traders, including the reliability of the KDJ indicator. The experience of traders also plays an important role in the success of a trade. The KDJ Indicator is one of the attractive options that traders can use to support their analytical needs in identifying the market.
As it is known that the KDJ Indicator is an indicator that was developed from the stochastic oscillator so that some of the shortcomings contained in the stochastic oscillator have certainly been perfected in the KDJ Indicator. That way, the KDJ Indicator can be said to be more reliable when compared to the stochastic oscillator. In addition, this indicator is also very easy to use and understand.
To make it more reliable, users also need to understand this indicator well and adapt it to their needs and trading style. The use of the right timeframes chart analysis also needs to be considered in this case and I can say that the use of long timeframes chart analysis can certainly minimize the possibility of false signal indications that can trap traders. This indicator should also be used in trending markets because it is more reliable for your trading and this indicator will not work in sideways markets because there are too many false signals in those conditions.
After studying it, I think this is one of the important indicators that I need to consider for me to use in any trading analysis that I will do in the future. By adding the KDJ Indicator to the chart and combining it with other relevant indicators, of course this becomes a more complete combination and makes the indicators that I use more accurate and specific in identifying the market even though it does not mean 100% accurate. I believe that this indicator has a high percentage of reliability if implemented properly and supported by good risk management as well of course.
Q3.) How is the random index added to a chart and what are the recommended parameters? (Screenshot required)
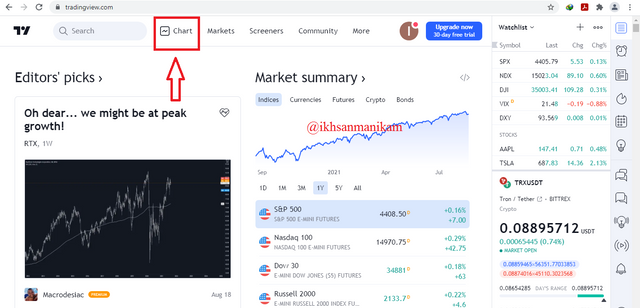
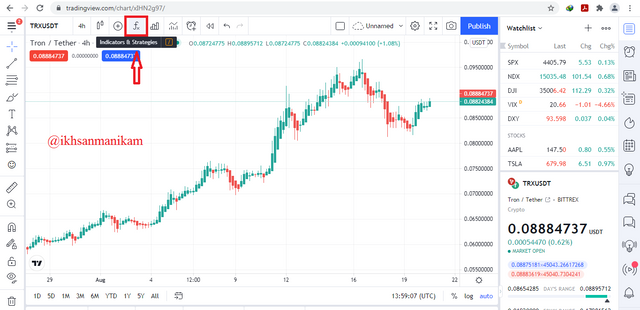
In this section, I will demonstrate it using the site page view on https://www.tradingview.com and You just need to follow a few simple steps below.
- After entering this website page, then click "Chart" located at the top of the page as shown in the following image.
- After entering the Chart page, then click "Fx Indicators" located at the top of the page as shown in the following image.
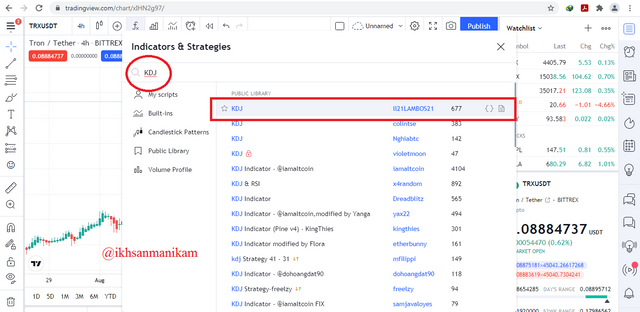
- Then a pop-up menu will appear to search for a number of indicators, in the search field write "KDJ" and I will choose KDJ Indicator made by 1121LAMBOS21 which appears on the top choice as shown in the following image.
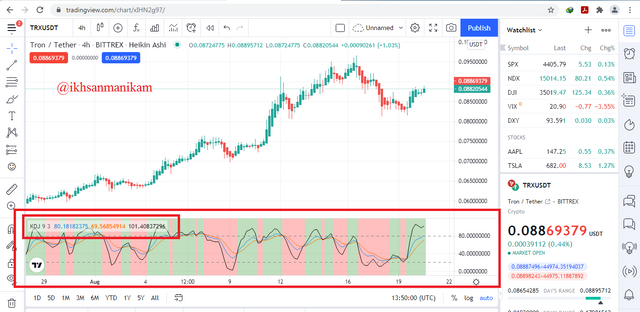
- Now the KDJ Indicator has been successfully added to the Chart and here is the trading chart display.
- After adding it, you can also customize it according to your needs. Click the "gear" logo on the indicator as shown in the following image.
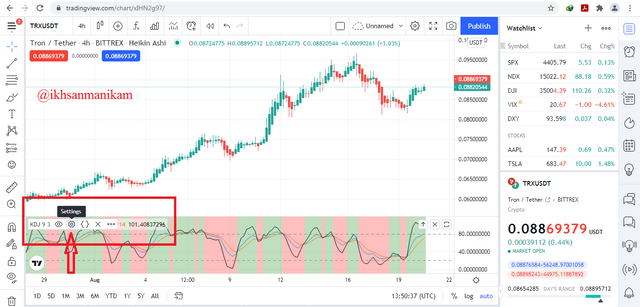
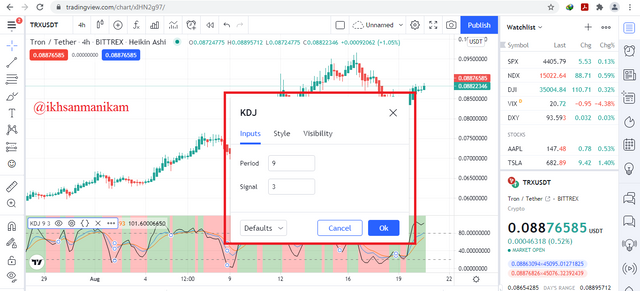
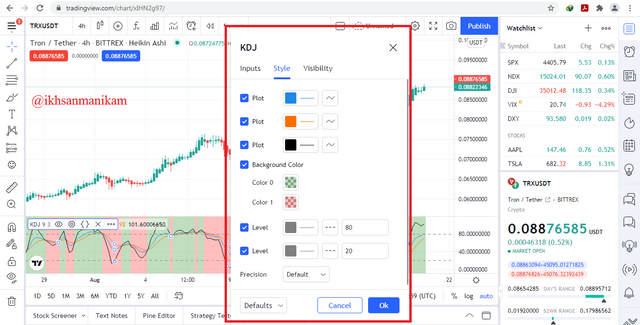
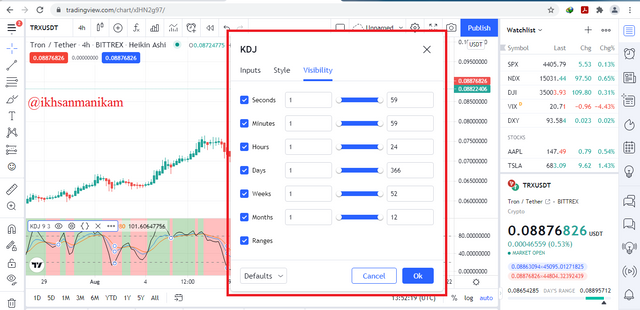
- Then a pop-up menu will appear offering 3 options, namely “Inputs”, “Style”, and “Visibility”. Here are some of those views and you can modify them to your liking.
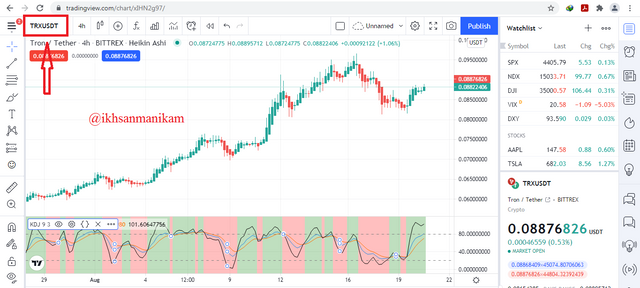
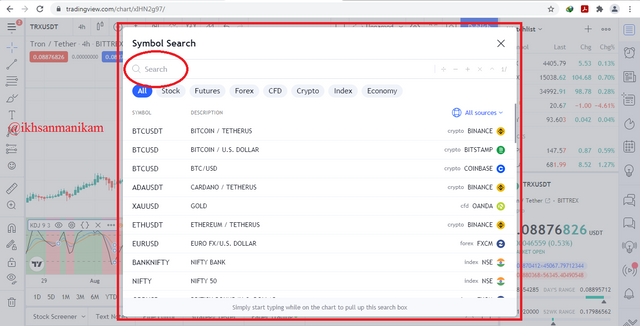
- You can also select and change the various trading pairs you need in the trading pairs column in the upper left corner and then a pop-up menu will appear to search for the trading pairs you want as shown in the following image.
After applying a few simple steps above, now you also need to consider the various parameters that are usually recommended by a number of traders. In step 6 above I have shown the KDJ Indicator parameter configuration menu which consists of “Inputs”, “Style”, and “Visibility”. For consideration, here are some of the main parameters to consider.
- The optimum period setting normally used is 9 periods with 3 signals.
- The Overbought zone setting is in the 80-100 value range, while the Oversold zone is in the 20-0 value range.
- Visually, the K-line color setting is usually blue, the D-line is red, and the J-line is black. While the green background setting is for Uptrend conditions and the red background is for Downtrend conditions.
- It is recommended to use long timeframes chart analysis to prevent false signals.
- It is not recommended to use this indicator on sideways markets because it tends to have a lot of false signals and should only be used on trending markets.
A number of traders believe that the use and application of these parameters is the optimum condition that is the best setting in identifying the market.
Q4.) Differences between KDJ, ADX, and ATR
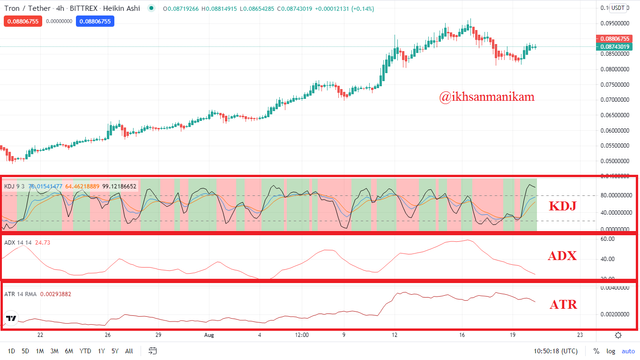
Basically, you can use these three indicators as an option that can help your trading and you can combine them to determine a market condition based on three different references, that way you can decide what action you should take on your trade in more well detail of course. To understand them well, then you also need to know the differences between the three, some of which are as follows.
- KDJ is also known as Random Index, ADX stands for Average Directional Index, while ATR stands for Average True Index. The naming also reflects the differences between them.
- KDJ is used to identify Buy Signals & Sell Signals and see Overbought & Oversold conditions, ADX is used to identify the strength of a trend (Bullish & Bearish), while ATR is used only to identify the level of market volatility.
- KDJ is also very suitable to be used to identify market price movements, while ADX & ATR are not.
- KDJ consists of three combination lines (K-D-J), while ADX and ATR only use one indicator line. That way, ADX & ATR need an additional Directional Index line (DI+ & DI-) to support their reading.
- The best period setting on the KDJ Indicator is 9 periods, while ADX & ATR are 14 periods.
- KDJ usually gets better when combined with ADX & ATR, while ADX & ATR is usually combined with Moving Average.
I've also covered ADX well in my post last week, you can see it on: LINK
Q5.) Use the signals of the random index to buy and sell any two cryptocurrencies. (Screenshot required)

KDJ Indicator is very helpful for traders in identifying the market and determining what choices to make, Buy or Sell. Using this indicator, traders can decide Buy or Sell based on two main indications, namely based on two types of cross-spots called golden-fork & dead-fork and based on overbought & oversold conditions.
The golden-fork is the starting point that has the potential for an Uptrend and this becomes a Buy Signal for traders, while the dead-fork is a starting point that has the potential for a Downtrend and this becomes a Sell Signal for traders. To be sure, traders can wait one or two candles after the “cross-spot” occurs so that traders can confirm market conditions more validly.
Overbought conditions can also be a Sell Signal for traders because the market has the potential to experience a trend change from an Uptrend to a Downtrend after this condition, while an Oversold condition becomes a Buy Signal for traders because the market has the potential to experience a trend change from a Downtrend to an Uptrend after this condition. Trend reversal is one of the things that usually happens in the market and traders will take advantage of this to make a lot of profit.
In this section I will demonstrate the use of the KDJ Indicator signal in the case of buying and selling two different cryptocurrencies. I will trade SUSHI/USDT and XLM/USDT using My Demo Account on Phemex platform https://testnet.phemex.com/
SUSHI/USDT
a. Buy
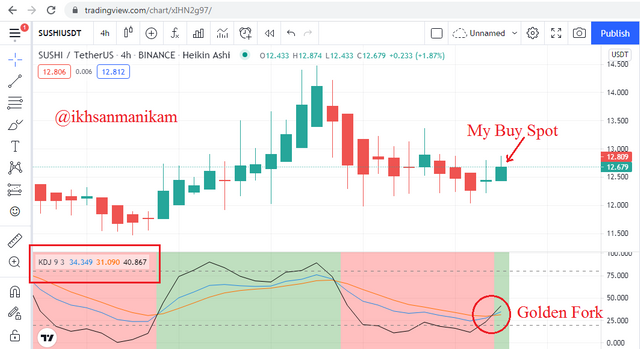
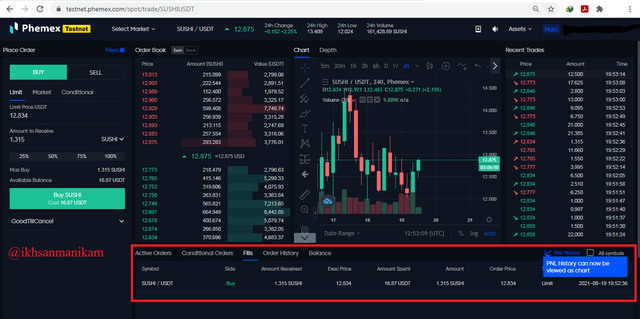
Based on the picture, it can be seen that I have bought 1,315 SUSHI using a capital of 16.87 USDT because I bought it at a price of 12,834. I decided to buy SUSHI because I saw the KDJ Indicator on the SUSHI/USDT chart analysis showed the potential for an Uptrend to occur and this was evidenced by the appearance of a golden-fork and the golden-fork was formed not far from the oversold zone. Based on the principle of the KDJ Indicator, of course this is a very strong “Buy Signal” indication for traders. Traders also need to set a stop-loss that is not far below the purchase price.
b. Sell
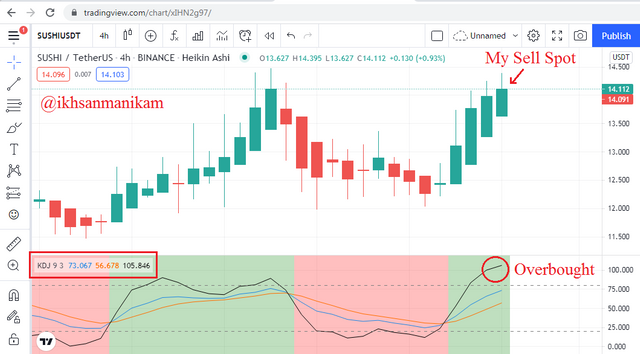
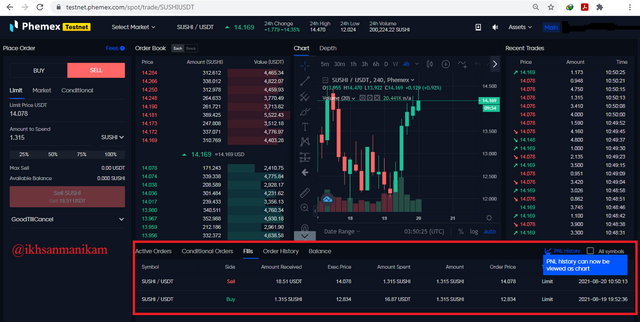
Based on the picture it can be seen that I have managed to sell 1,315 SUSHI for 18.51 USDT because I sold it at 14,078 and that means I made a profit of 1.64 USDT from this trade. I decided to sell SUSHI because I saw that the KDJ Indicator on the SUSHI/USDT chart analysis has shown overbought conditions and maybe after that there could be a potential trend reversal although this has not been fully confirmed because the dead-fork has not appeared on the chart either. Based on the principle of the KDJ Indicator, of course this is a very strong “Buy Signal” indication for traders because %J has already reached 105,846 and maybe a dead-fork will also appear soon after this. I think these conditions are also classified as potential conditions for placing sell-orders and I don't want to be too greedy while in the market, I will always act realistically.
XLM/USDT
a. Buy
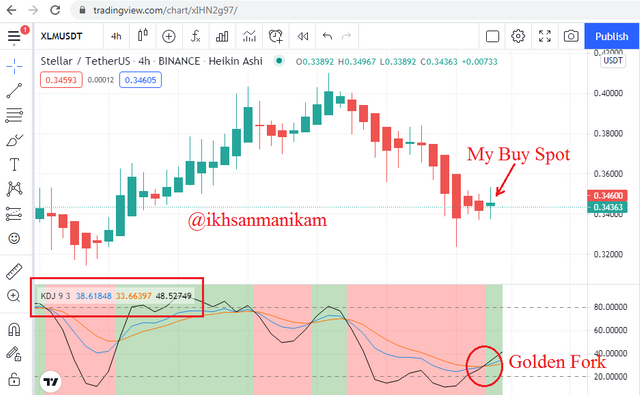
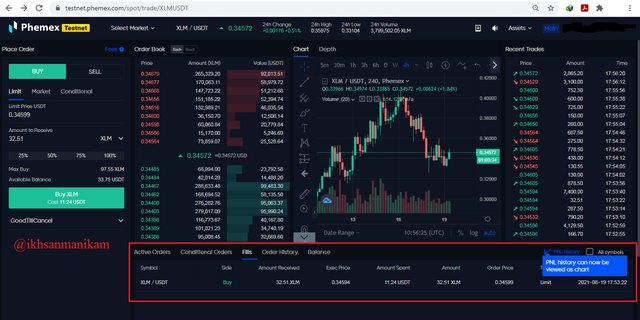
Based on the picture, it can be seen that I bought 32.51 XLM using 11.24 USDT of capital because I bought it at 0.34599. I decided to buy XLM because I saw the KDJ Indicator on the XLM/USDT chart analysis showed the potential for an Uptrend to occur and this was evidenced by the appearance of a golden-fork and the golden-fork was formed not far from the oversold zone. Based on the principle of the KDJ Indicator, of course this is a very strong “Buy Signal” indication for traders. Traders also need to set a stop-loss that is not far below the purchase price.
b. Sell
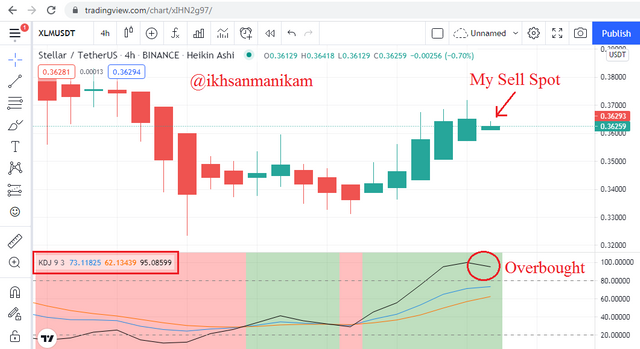
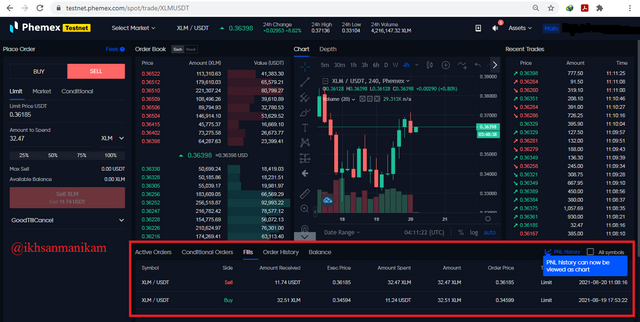
Based on the picture it can be seen that I have managed to sell 32.47 XLM for 11.74 USDT because I sold it at 0.36185 and that means I made a profit of 0.5 USDT from this trade. I decided to sell XLM because I saw that the KDJ Indicator on the XLM/USDT chart analysis has shown overbought conditions and maybe after that there could be a potential trend reversal although this has not been fully confirmed because the dead-fork has not appeared on the chart either. Based on the principle of the KDJ Indicator, of course this is a very strong “Buy Signal” indication for traders because %J has already reached 95,086 and maybe a dead-fork will also appear soon after this. I think these conditions are also classified as potential conditions for placing sell-orders and I don't want to be too greedy while in the market, I will always act realistically.
Trading Result
Initial Cap = (SUSHI/USDT initial trading cap) + (XLM/USDT initial trading cap)
= 16.87 USDT + 11.24 USDT = 28.11 USDT
Final Cap = (SUSHI/USDT final trading cap) + (XLM/USDT final trading cap)
= 18.51 USDT + 11.74 USDT = 30.25 USDT
Profit = Final Cap - Initial Cap = 30.25 USDT – 28.11 USDT = 2.14 USDT
Profit Percentage = (Profit / Initial Cap) x 100% = (2.14 / 28.11) x 100% = 7.62%
KDJ is an indicator that runs based on trends so it is not suitable for use in sideways market conditions. This indicator consists of three main lines K-D-J with two main value points 20 & 80. Uptrend is indicated when the J line is above K & D, and vice versa. When the J-line value is below 20 it means Oversold and if it is above 80 it means Overbought. But sometimes the KDJ Indicator can give false signals, therefore traders need to understand this indicator well and combine it with other indicators such as Average Directional Index (ADX) and Average True Range (ATR). It should also be noted that no signal is 100% accurate and traders should always set stop-losses to prevent bigger losses if the worst happens.
Superb performance @ikhsanmanikam!
Thanks for performing the above task the eighth week of Steemit Crypto Academy Season 3. The time and effort put into this work is appreciated. Hence, you have scored 8.5 out of 10. Here are the details:
Remarks
Overall, you have displayed a good understanding of the topic. You have performed the assigned task excellently. However, you did not provide new information to this course as most of the points mentioned have been indicated by several participants.
Thank you Professor @asaj . Actually I have tried to provide additional information for this course by presenting a good presentation, especially in the calculation section. I've illustrated calculations with actual case examples that may not have been in this course. I also present a complete explanation of KDJ just by looking at one chart, as seen in the chart picture in the first question and the conclusion section because I am trying to find a complete chart so that readers can easily understand it in one chart picture.