Steemit Crypto Academy Season 3 Week 7 | Homework Post for Professor @yousafharoonkhan - TradingView

As-Salaam-Alaikum, how are you guys today? I hope you are always healthy. Today I will try again to write in the Steemit Crypto Academy community and this time I will take a class given by professor @yousafharoonkhan, this class discuss about "TradingView". There are five main questions that must be answered in this homework and in this post I will try to answer these questions. Let's get started...
Q1.) Defining the TradingView site and how to register an account in TradingView? What are the different registration plan? (screenshot necessary)
Defining the TradingView site
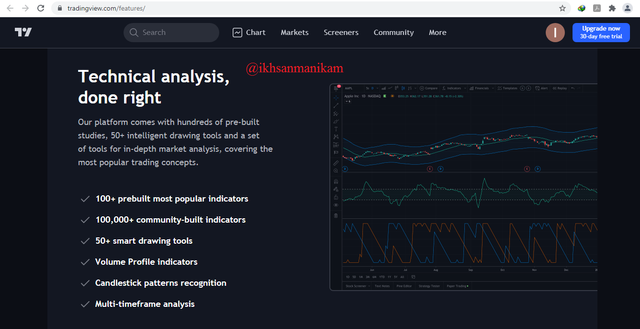
TradingView is one of the most important websites for traders and has probably been used by almost all traders around the world because it provides a number of important information that is very helpful for traders, especially in seeing market movements, market trends, and various other developments that occur in the market in real time, then traders can also make an analysis using various Trading Tools-Indicators available here, very useful. Here traders can also see various historical data from various trades and this is usually used for a comparison.
Through this site, traders can easily access various charts of various trades from around the world with various trading pairs, ranging from trading in cryptocurrency assets, stocks, forex, and other commodities such as Gold. Charts that are updated in real-time are the main needs that are needed by every trader to carry out various technical analyzes with the help of various indicators and are also supported by experience and other knowledge that they already have, so that traders can decide what action to take for the trades they do and of course with better consideration, and be a smart trader.
Different registration plan
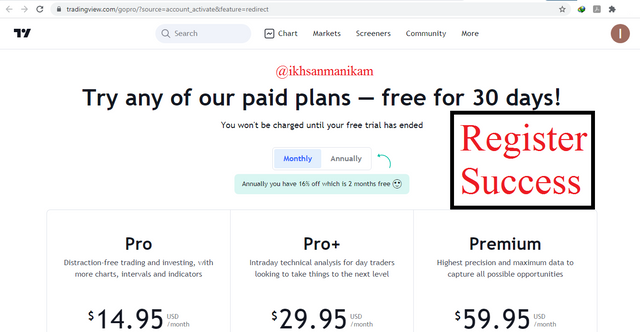
TradingView offers four options in the registration process, starting from the “Free Basic” option, then there is also the “Pro”, “Pro+” option, and finally “Premium” option. The four options also have different requirements of course. As an initial trial, you can use the free option to explore it for a whole month, but in this option you can only add a maximum of 3 indicators on one chart and those are indicators that are classified as free.
While the other three options are paid memberships with different rates and with different benefits of course. The “Pro” package costs $14.95 per month, while the “Pro+” package costs $29.95 per month, and the “Premium” package costs $59.95 per month. For clarity, here is an image that will describe the three options.
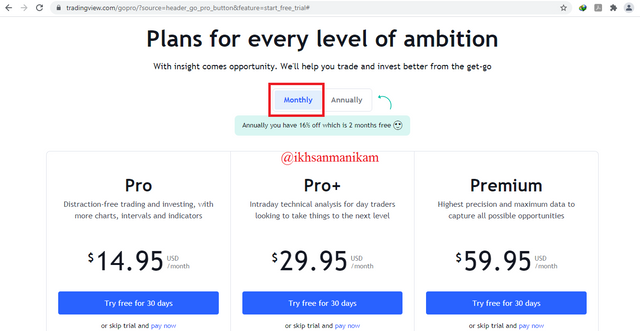
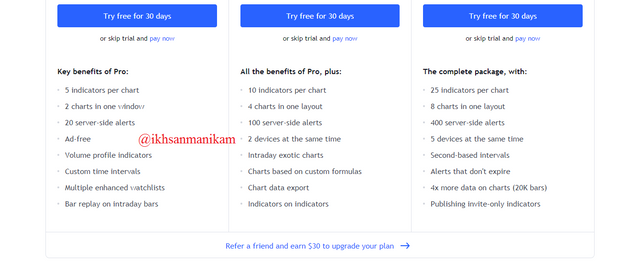
“Pro” users will get 8 main benefits, while “Pro+” users will get 16 main benefits and 8 of them are benefits that are already available to “Pro” users. For “Premium” users, they will get full access with details of 24 main benefits and 16 of them are benefits that are already available for “Pro+” users.
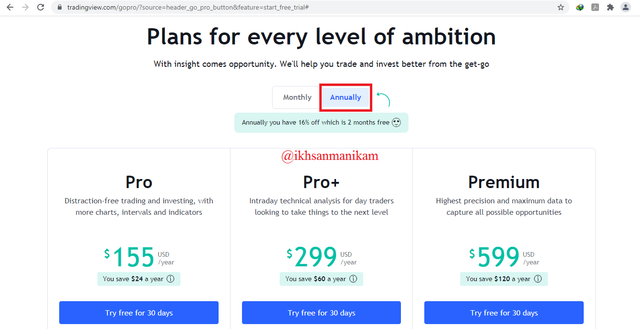
Apart from being able to subscribe monthly, TradingView also provides an annual subscription option and if you calculate it then you will save 2 months of subscription fees if you decide to buy an annual subscription package. The “Pro” plan costs $155 per year, while the “Pro+” package costs $299 per year, and the “Premium” plan costs $599 per year.
How to register an account in TradingView
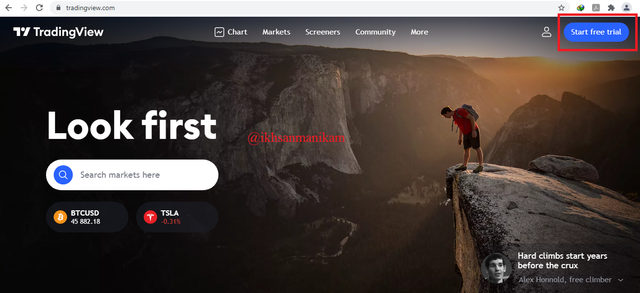
First let's visit the official site https://tradingview.com/
There are a few simple steps to follow in creating an account on the TradingView platform and in this section I will show you the steps on how to create a “free trial account” on the TradingView platform. Here is the tutorial.
- After logging into the site, look at the top right corner and click "Start free trial" as shown in the below image.
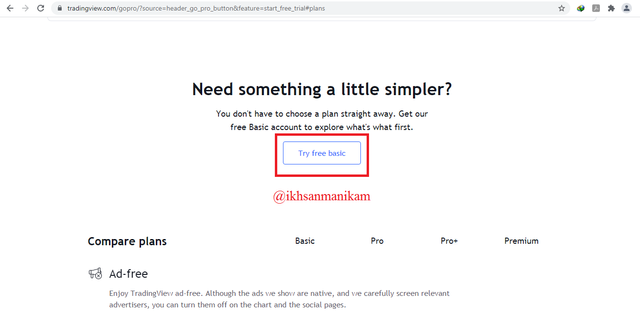
- Then scroll down the page and click "Try free basic" as shown below.
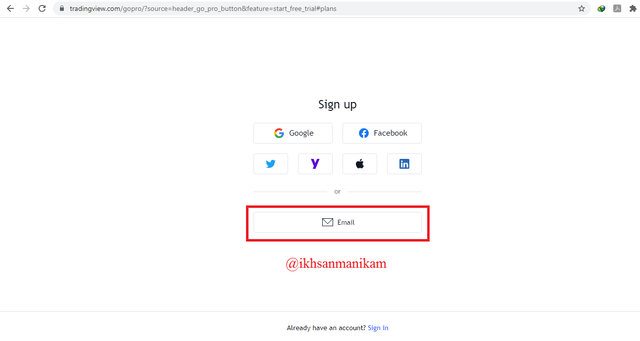
- Then several options will appear to verify the account, such as Google, Facebook, Twitter, Yahoo, LinkedIn, and Email. I'll use an Email account because it's simpler.
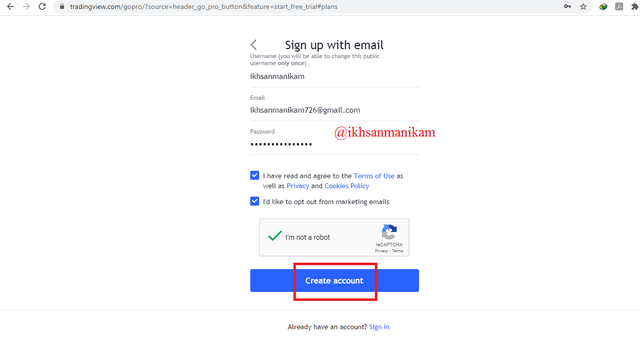
- Then a registration form will appear that must be filled and checked as shown in the image below. And then click “Create account”.
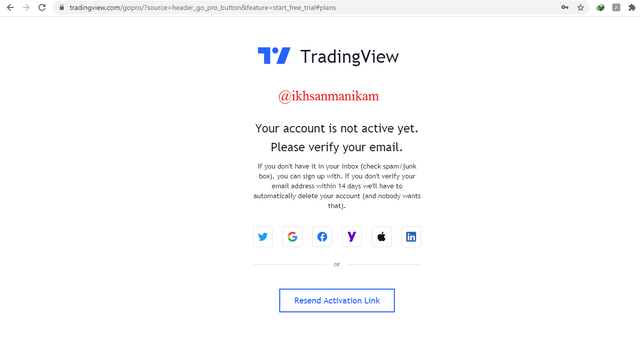
- Then a notification page like the following will appear asking you to open your email and verify the link that has been sent to your email.
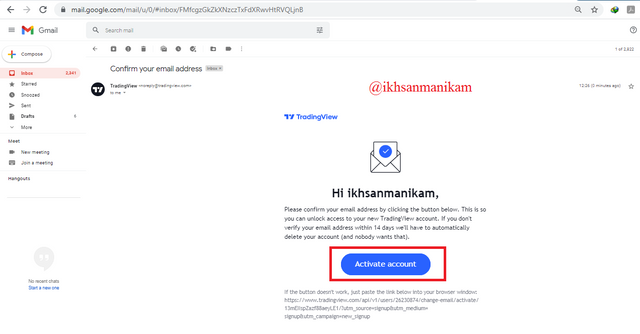
- Open your email box and open the message sent by the TradingView platform, then click “Activate account” as shown in the image below.
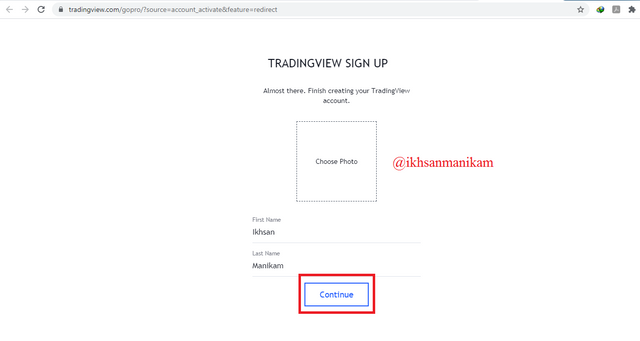
- Then you can adjust the appearance of your profile as shown in the image below. In this section you can input a photo of yourself and fill in the display name as you wish.
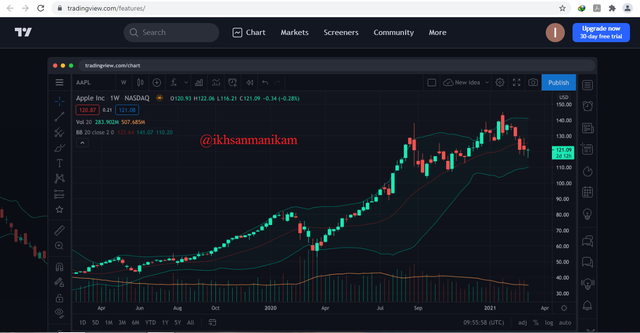
- The following is the appearance of the TradingView platform after you have successfully registered.
Now the free account has been successfully registered and can be used according to the applicable conditions, good luck.

Q2.) Explain the different features of TradingView and what is your favorite feature and why? (screenshot necessary)
Different features of TradingView
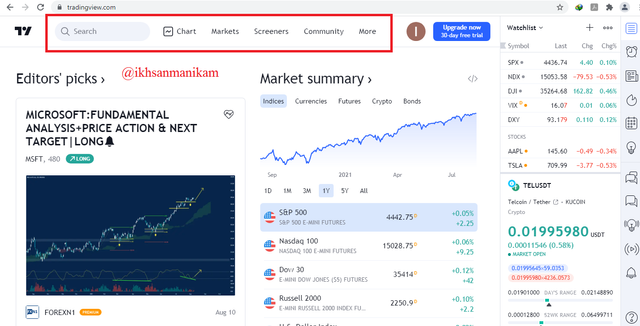
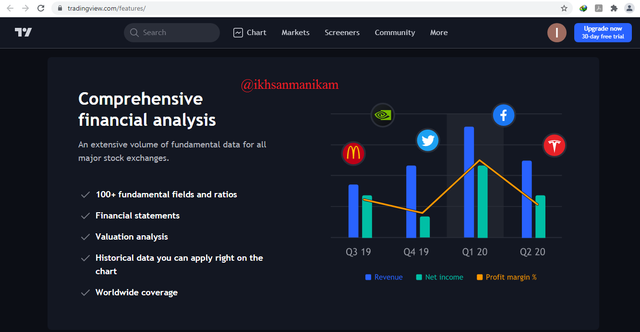
There are many features provided by the TradingView platform and all these features are very useful for us of course, you can explore them as you wish. To facilitate navigation, there are several main features that are placed at the top of the page and these features consist of a search column, Chart, Markets, Screeners, Community, Watchlist, and More.
a. Chart
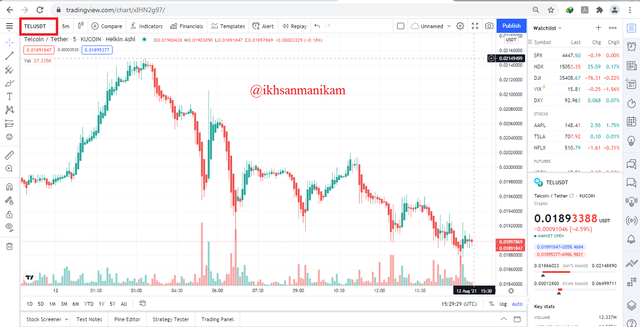
This is a feature that allows users to view various real-time market conditions of various trading assets based on a visual display that is easy to understand and this is usually called Price Chart. To make it easier for users to observe and make various analyses, this display also supports the use of various trading tools and various indicators in particular so that users can apply them directly on the screen they are looking at. Almost all the necessities that traders usually use to make technical analysis can be found here.
b. Markets
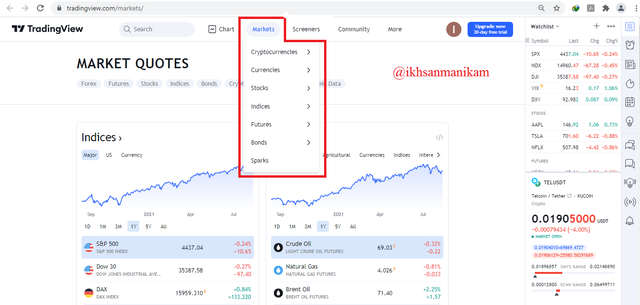
This feature presents various real-time information and various historical data from various trading assets, ranging from Cryptocurrencies, Currencies, Stocks, Indices, Futures, Bonds, and Sparks. All information related to the performance of all these trading assets will be displayed here and you can explore them widely, such as Marketcap, Circulation Supply, Volume, Price, Exchange, Rating and many more.
c. Trade
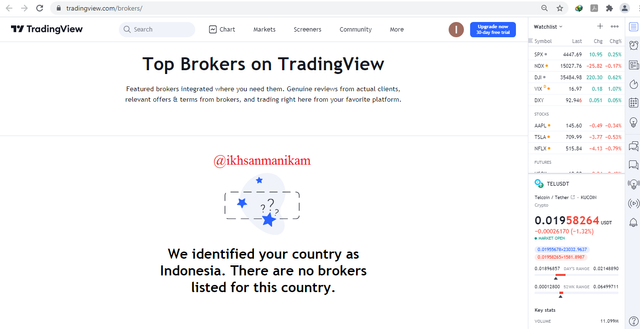
This is a view that presents the latest information about a number of top Broker references that you may be able to use as an option in helping your trading interests and you can visit the official website via the link provided. But unfortunately on the display it appears that there is no Broker available in my country, Indonesia.
d. Screeners
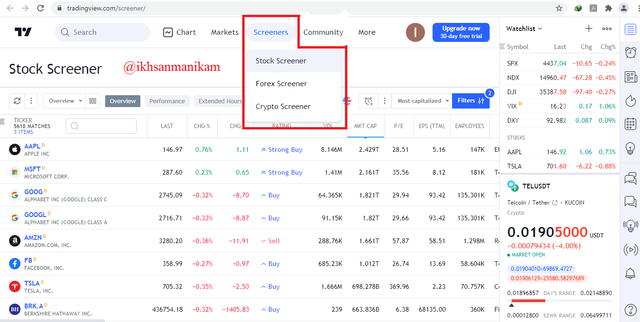
This feature allows users to check the latest activity of various trading assets in more detail such as Last Price, Change, High-Low Price, Volume, Rating, and many more. Based on asset category, this feature is grouped into three sections, namely Crypto Screener, Stock Screener, and Forex Screener.
e. Community
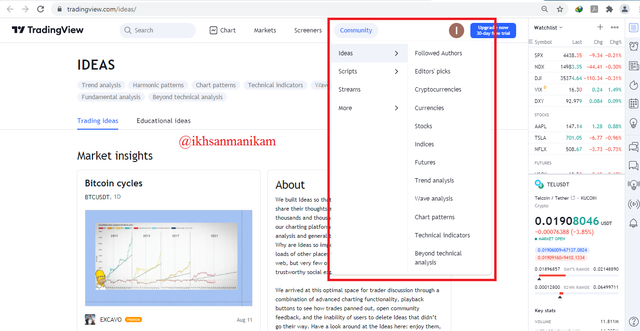
This is a feature that provides various information about various trading assets based on various sources such as interesting articles made by experts, forums, author's opinions, and various other trading experiences. Users can collect various information on this feature through different categories and this can provide different experiences for the users.
f. Watchlist
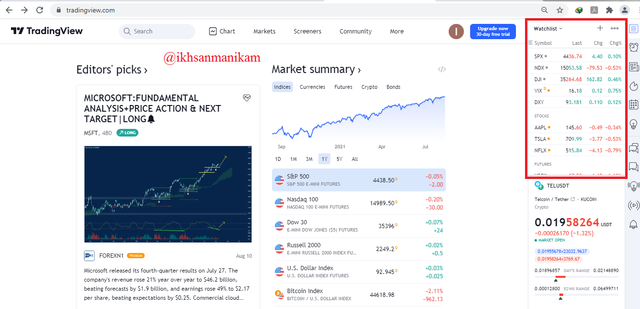
This is a feature that allows users to monitor the progress of various preferred assets and you can freely add the assets you are currently monitoring to this list. Through this display, you can monitor the development of these assets more easily on one screen display and the navigation is also easier.
My favorite feature and the reason why
If the favorite feature can be considered as a feature that is often used, then I can say that the “Chart” feature is the feature I use the most on the TradingView platform because I often observe the development of charts on several assets that I own and develop various strategies based on technical analysis using A number of indicators are available here.
Indicators are the main reason why I often use the “Chart” feature because Charts and Indicators are the two main things needed in making technical analysis and I always need technical analysis on every trade I make. TradingView fully supports the various needs of traders and everything traders need in making technical analysis is provided in the “Chart” feature. This feature also supports drawing and provides an additional menu on the right side to monitor assets that have been added to the “Watchlist” list.
I see that this feature is very complete and very usefull. Traders can create various trading strategies using technical analysis in their own way and they can start from here. This is a great feature on this great platform.
Q3.) How to set up a chart in TradingView and use two tools to edit it (screenshot necessary)
How to set up a chart in TradingView
You can set up the Chart in TradingView after you enter the page that displays the trading chart view as shown above. Once logged in, let's get started using a few simple steps.
a. Set up Time Interval
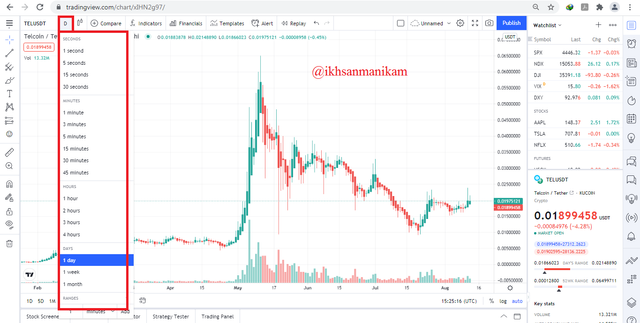
You can set the time interval for forming the candlestick according to your trading needs and to support the analysis that you will do of course. There are a number of options that can be used, ranging from 1 second to 1 month intervals as shown above. Traders who run Scalping Trading will usually choose time intervals that tend to be shorter such as 1 minute, 5 minutes, 10 minutes, and 15 minutes while traders who run Swing Trading will definitely use relatively longer time intervals, such as daily and weekly.
b. Set up Symbol Shape
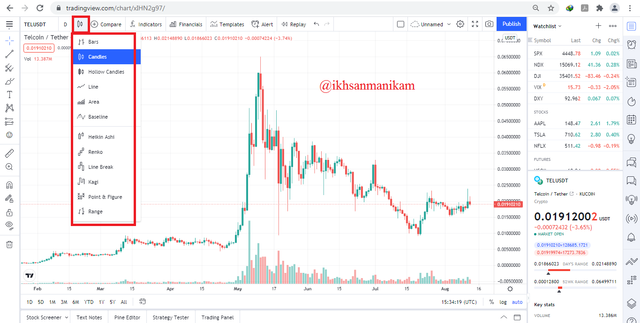
There are several options that you can use in this section and you can choose them according to your wishes. Usually the most used are Candles and Bars because they can provide the visuals that are preferred by most users.
c. Chart Properties Settings
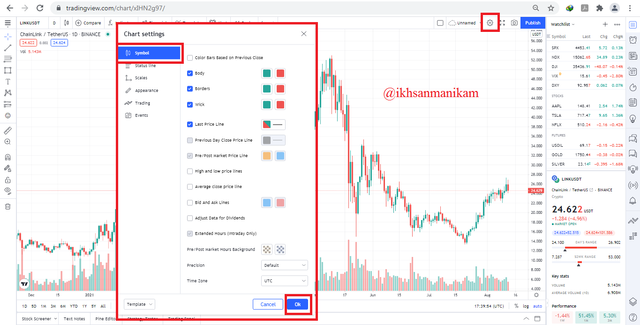
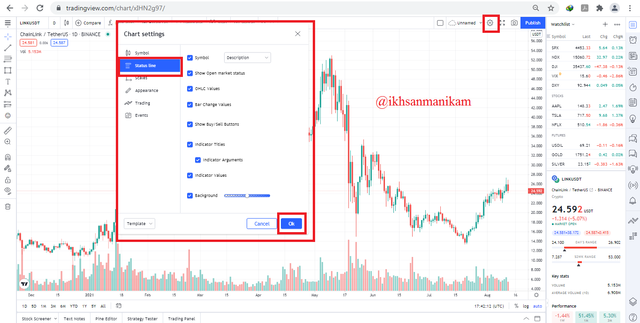
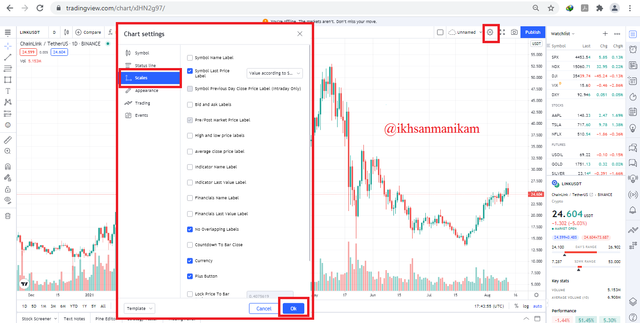
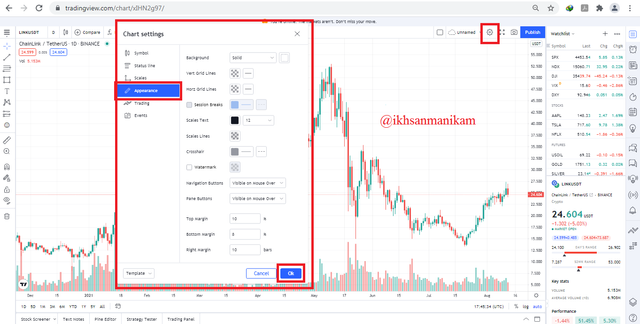
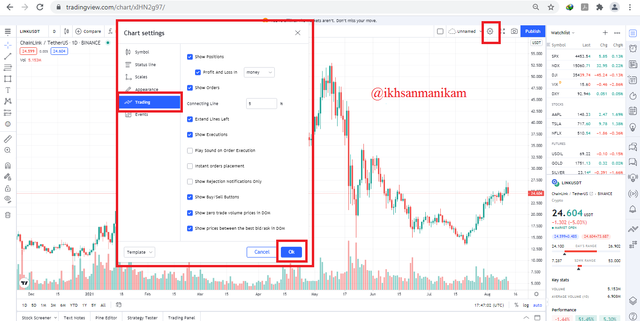
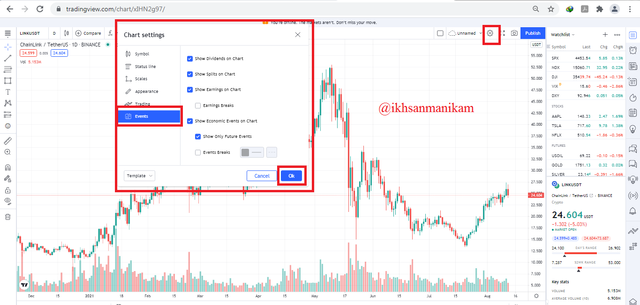
This section offers a more complete option for users to set up charts in more detail and you can try to apply them to your charts as you wish. Broadly speaking, there are 6 main categories, namely Symbol settings, Status Lines, Scales, Appearance, Trading, and Events. You can always modify your chart at any time as you wish.
Edit TradingView chart use two tools
There are various tools available on this platform and all of them can be used to make it easier for traders of course. In this section I will show you two simple tools that are often used by traders, namely Trend Line and Rectangle Geometric Shape.
a. Trend Line
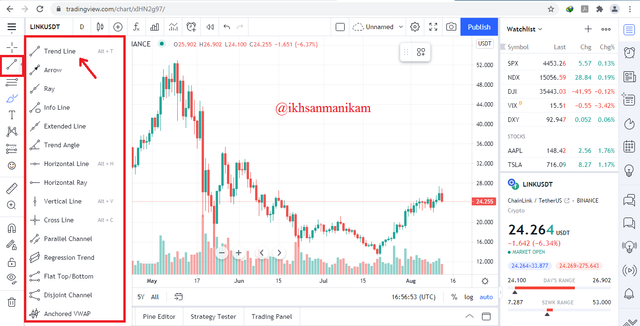
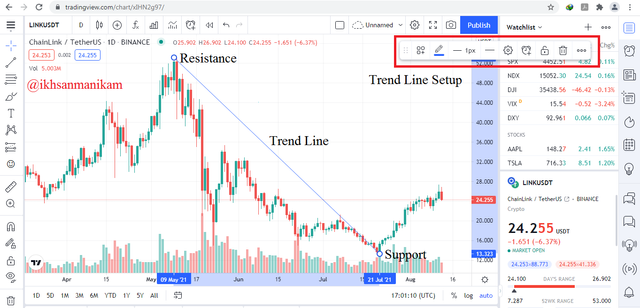
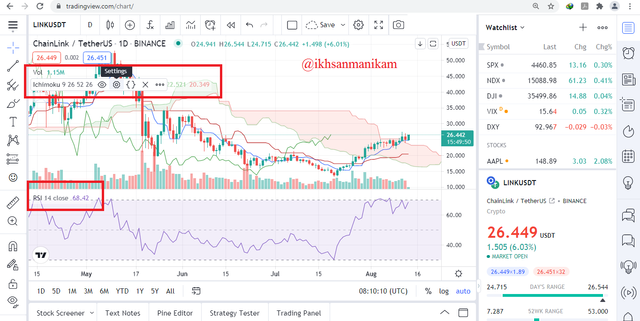
To apply it to your chart, first click “Trend line tools” then select “Trend line”. After that, move your cursor to draw the line to a certain part of your chart according to the analysis you are going to do. The picture above is an example of what I have done and in the picture it can be seen that I identified a Downtrend that was formed in the LINK/USDT trading pair and it can also be seen that there are Resistance points and Support points.
b. Rectangle Geometric Shape
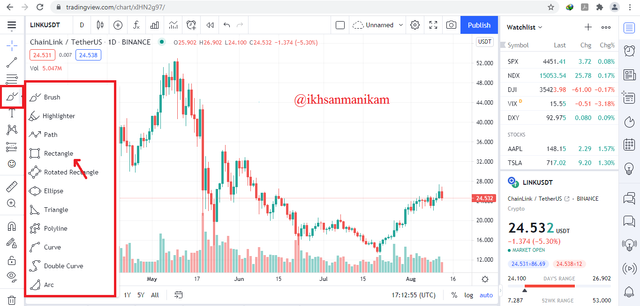
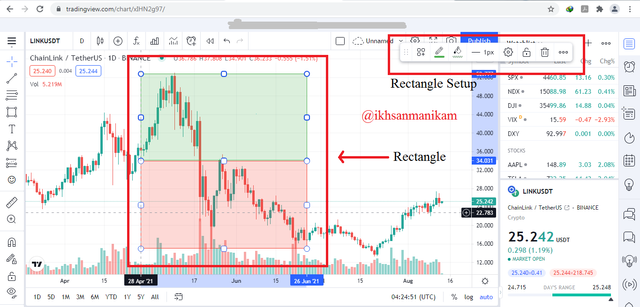
Besides Trend line, Rectangle is another tool that is often used by traders. To apply it to your chart, first click “Geometric Shape Tools” then select “Rectangle”. After that, move your cursor to drag the shape to a certain part on your chart according to the analysis you are going to do. The picture above is an example of what I have done and in the picture it can be seen that I identified the Bullish zone and the Bearish zone formed in the LINK/USDT trading pair.
Q4.) Explain how to add indicator in chart, what is your your favorite indicator and why? (screenshot necessary)
How to add indicator in chart
Indicators are one of the main requirements that are very important for traders in making a technical analysis. There are various indicators that you can use according to your trading needs and almost all types of indicators are already available on the TradingView platform and you can use them here. You just need to follow a few simple steps to add an indicator to your chart and here are the steps. In this example I will add two indicators to the chart, namely the Ichimoku Cloud and the RSI.
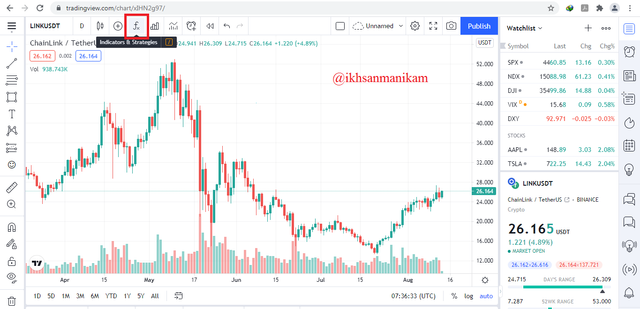
- First, click on the indicator icon with the “Fx” logo at the top of the page as shown in the following image.
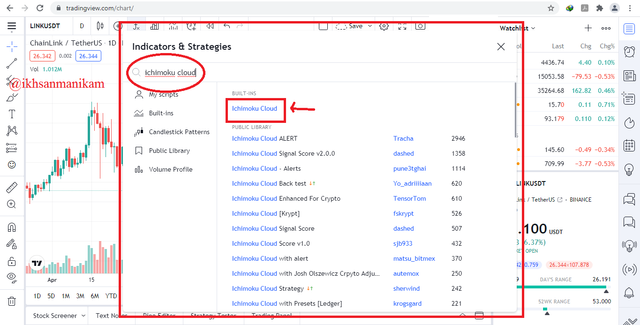
- Then a pop-up menu will appear to select various indicators. You can search for various indicators you need through the search field. I will try to write the word "Ichimoku Cloud" in the search field and then click the "Ichimoku Cloud Indicator" option that appears.
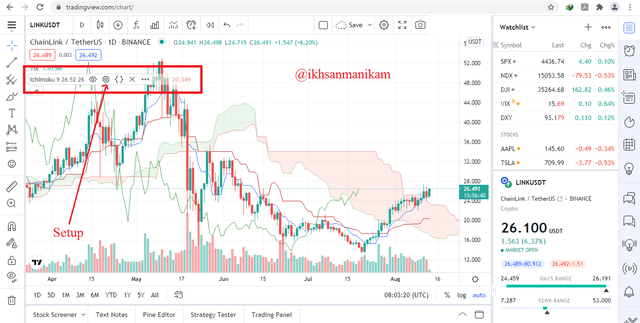
- After that you can close the Pop-Up menu because the indicator has been successfully added to the chart as shown in the following image and you can set the parameters by clicking the “gear” icon on the indicator. Now you can see the trading display that has been equipped with an indicator.
- In the same way, I also added the RSI indicator on my chart so that I can combine them together on one chart as shown in the following picture.
You can use the various indicators available on the TradingView platform by following these few simple steps. Good luck.
My favorite indicator and the reason why
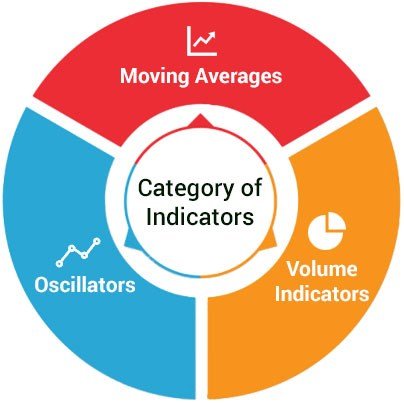
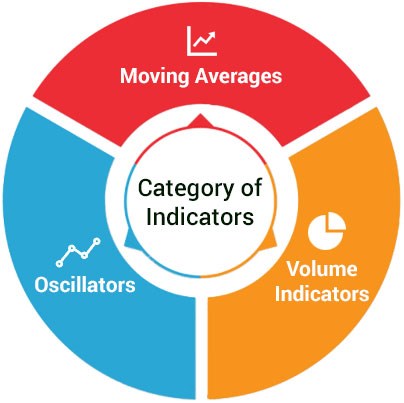
There are several indicators that I have used in my trading to date, such as Relative Strength Index (RSI), Moving Average (MA), Exponential Moving Average (EMA), Moving Average Convergence Divergence (MACD), Super Trend, Break Retest Break ( BRB), Market Structure Break (MSB), Ichimoku Cloud, Fibonacci Retracement, and sometimes I also observe Candlestick Patterns. Of these indicators, some of which I learned through this community and I also plan to study the Average Directional Index (ADX) indicator this week.
There is no favorite indicator for me because all of them can be used simultaneously and according to the needs of the trading strategy to be executed, it's all relative. But since I first entered the trading world a few years ago, the RSI was the first indicator I used and sometimes it seems like a must for me because I never move it from my trading chart screens on a number of platforms even though I have traded several other indicators in turn.
As additional information, the RSI is a simple indicator that can determine Overbought and Oversold conditions based on a 0-100 value scale and this is usually one of the basic indicators learned by novice traders because this indicator tends to be easy to understand. An RSI value above 50 indicates that the market is experiencing an increase while an RSI value below 50 indicates that the market is experiencing a decline.
But specifically, this indicator is understood as two zones, the Overbought zone is in the range of the RSI 70-100 value while the Oversold zone is in the range of the RSI value of 0-30. I usually assume that an RSI value below 30 is a Support Zone and I will start buying assets gradually, whereas if the RSI value is above 70 then I consider it a Resistance zone and I will sell my assets gradually. The use of this indicator will be better if it is combined with other indicators and in my opinion this indicator is more suitable for long-term trading.
Q5.) Predicting the market for cryptocurrency (trend/price) using TradingView, usefull or not?
I think this is an undoubted thing and I would definitely say the answer is “Of Course, Yes” because it has been proven by most traders who have used this platform to determine this for various reasons, myself included.
Traders cannot control market prices, but can make a number of predictions in various ways even if they are not 100% accurate. Market psychology is something that can be predicted because the market cycle will always repeat itself and to make a prediction with better accuracy, traders also need to do an analysis, both fundamentally and technically and require various indicators as needed of course.
This platform provides various trading charts in various time frames in real-time and various indicators & trading tools are also provided by this platform to make it easier for users to carry out technical analysis, including the use of trend lines and the provided Super Trend indicator to determine market trends based on price charts. In simple terms, trends can also be identified using a number of indicators commonly used by traders such as the Moving Average (MA) and Exponential Moving Average (EMA). The Break Retest Break (BRB) and Market Structure Break (MSB) indicators can also be used in this case.
In addition, we can also determine the right entry and exit points by using various other indicators that are also often used by traders such as the Fibonacci Retracement indicator. Based on Overbought and Oversold conditions, we can also determine the appropriate entry and exit points and then make a better prediction using the Relative Strength Index (RSI) indicator. Everything that the TradingView platform provides is highly functional and very useful for traders, especially the various indicators that can be used to predict the crypto market.
With the many advantages it has to offer, TradingView has grown to become one of the most used platforms by traders. This platform is very important and very useful for traders in carrying out various trades because TradingView provides various information needed by traders, both information from actual and historical data. TradingView is also widely accessible and user-friendly with an easy-to-understand interface.
Until now, Traders have found it very helpful with the presence of TradingView, traders can carry out various technical analysis through this platform because almost all trading tools and almost all indicators are available here, there is no other platform of this kind that is better than TradingView and I think TradingView is the best for now. With TradingView's help in conducting technical analysis, traders can be more confident when in the market and can determine the best entry and exit. Thank you TradingView and Thank you Professor.
Please prof @yousafharoonkhan my work has been skipped
https://steemit.com/hive-108451/@sadiqxylo/crypto-academy-season-3-week-7-homework-post-for-professor-yousafharoonkhan
?????
Respected first thank you very much for taking interest in SteemitCryptoAcademy
Season 3 | intermediate course class week 7
it is also depend on traders that for what purpose he is going to use the tradingview, it is true that traders can not control trade but just can predict with the help of many indicators , tool that are avaiable on tradingview
thank you very much respected for sharing this great homework , i
thank you very much for taking interest in this class
Thank you very much professor