Steemit Crypto Academy Season 3 Week 5 | Homework Post for Professor @kouba01 - Ichimoku Kinko Hyo Indicator

Hello everyone, how are you guys today? I hope you are always healthy. Today we meet again on my blog, with a different atmosphere and theme of course. Today I will try again to write in the Steemit Crypto Academy community and this time I will take a class given by professor @kouba01, this class discusses about "Trading Crypto with Ichimoku Kinko Hyo Indicator". There are six main questions that must be answered in this homework and in this post I will try to answer these questions. Let's get started...

Q1.) Discuss your understanding of Kumo, as well as its two lines. (Screenshot required)
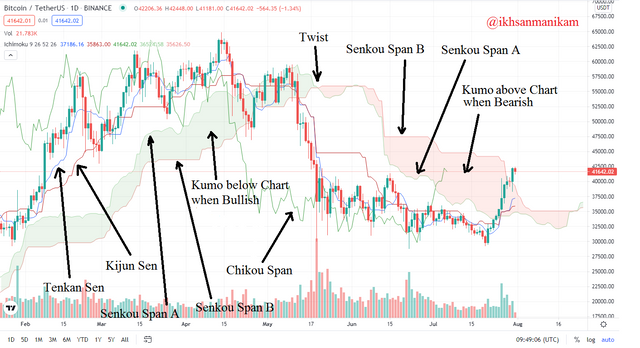
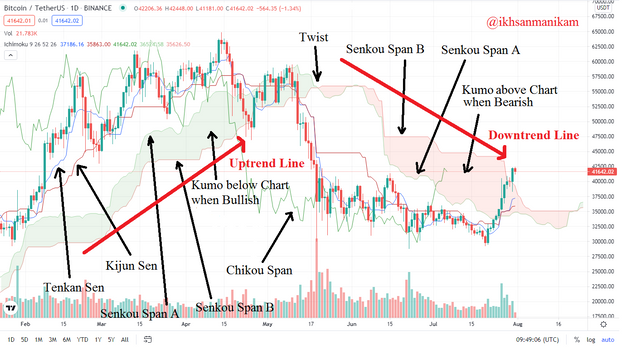
Kumo is the Ichimoku Cloud which is an important element in the Ichimoku Kinko Hyo Indicator in displaying market visuals to help traders identify market conditions such as price momentum, market trends, trend reversals, support levels, resistance levels, sideways and others.
Kumo is the space formed between the Senkou Span A line and the Senkou Span B line due to the difference in distance between the two. The Senkou Span A line is the average value between the Tenkan Sen line and the Kijun Sen line of the last 9 periods plotted against the next 26 periods while the Senkou Span B line is the median value between the highest and lowest points of the last 52 periods plotted against 26 future period.
The Kumo that is formed between the Senkou Span A line and the Senkou Span B line can describe which force is more dominant in the market, whether supply or demand. When it is bullish, the Senkou Span A line is above the Senkou Span B line, the direction is moving upwards, and the price chart is above the Kumo which indicates that the demand is greater than the supply, thus pushing the price up and vice versa. Meanwhile, Kumo which moves horizontally to the right, indicates that the market is sideways. Kumo color can also be interpreted, green Kumo is Bullish while red Kumo is Bearish.
Here are three examples of trading charts using the Ichimoku Kinko Hyo Indicator in three different conditions, namely Uptrend (Bullish), Downtrend (Bearish), and Sideways (Neutral or Without Trend).
Uptrend
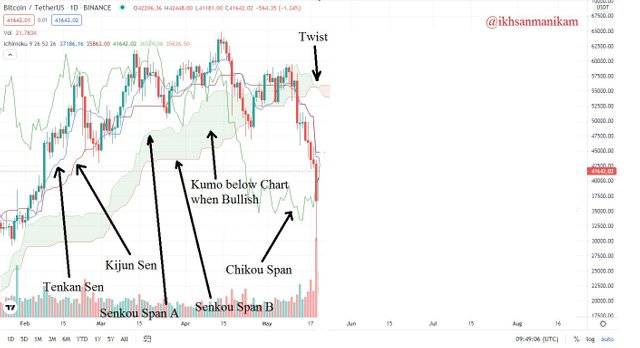
The Senkou Span A line is above the Senkou Span B line, the direction is moving upwards, and the price chart is above the Kumo.
Downtrend
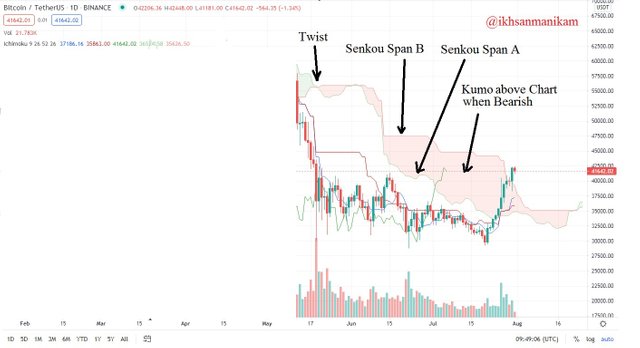
The Senkou Span A line is below the Senkou Span B line, the direction is moving downwards, and the price chart is below the Kumo.
Sideways
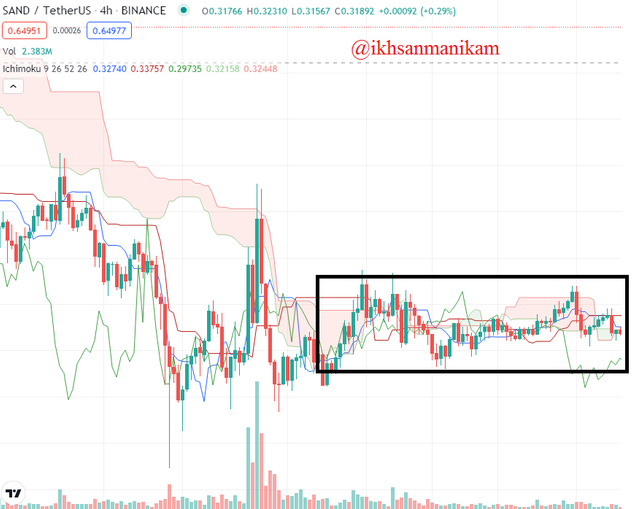
Senkou Span A line and Senkou Span B line are leading alternately in a short time interval and moving horizontally to the right, there is no strong trend here and the price chart is between Kumo shading. Usually this indicates that the market is going through an Accumulation phase.
Q2.) What is the relationship between this cloud and the price movement? And how do you determine resistance and support levels using Kumo? (Screenshot required)
Relationship with Price Movement
When the Senkou Span A line is above the Senkou Span B line, then the direction is moving upwards, and the price chart is above the Kumo, it shows that the market condition is bullish and vice versa. This is the main concept, but Kumo Thickness is also worth noting in this regard.
Kumo Thickness can also indicate the level of volatility that occurs in the market, the higher the Kumo Thickness formed, the higher the price volatility, and vice versa. A Thick Kumo can create stronger Support and Resistance levels, while a Thin Kumo is weaker. The thicker the Kumo that is formed, the stronger it will resist price movements to break in, and vice versa. Here are some illustrations that show the effect of Kumo Thickness (Thick Kumo and Thin Kumo) on price movements.
Thick Kumo
- Uptrend
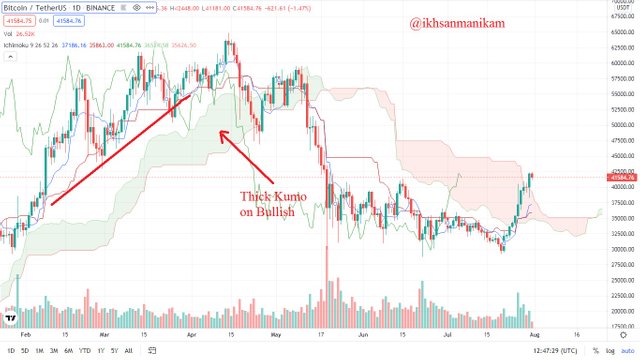
Based on the price chart above, it can be seen that there is a Thick Kumo formed in an Uptrend condition. The picture also shows that the Price Chart is moving away from the Thick Kumo.
- Downtrend
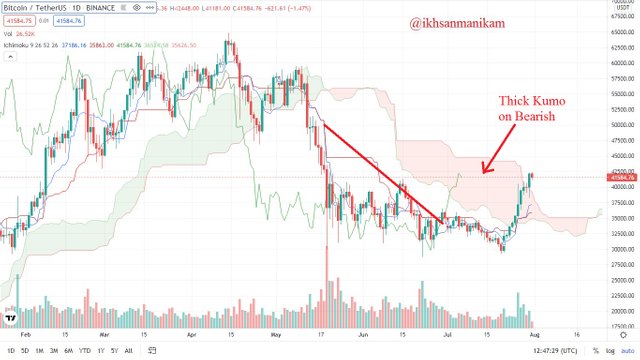
Based on the price chart above, it can be seen that there is a Thick Kumo formed in a downtrend. The picture also shows that the Price Chart is moving away from the Thick Kumo.
Thin Kumo
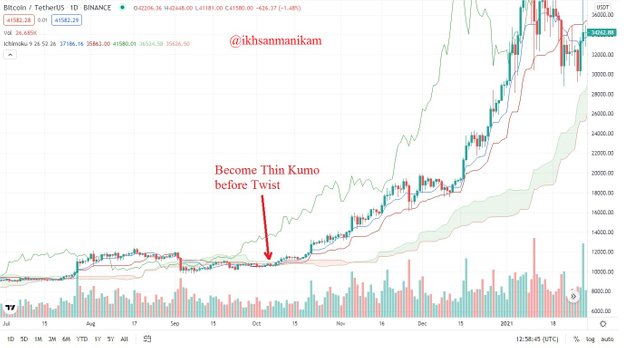
- Uptrend
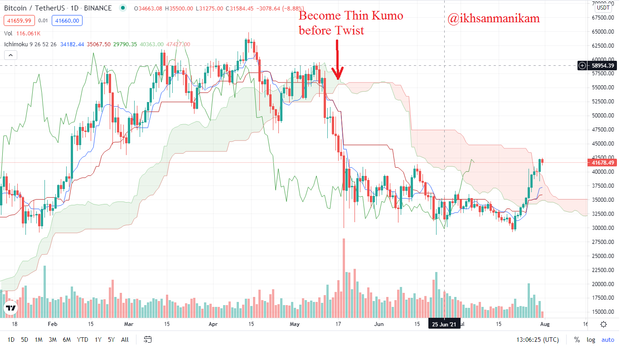
Based on the price chart above, it can be seen that there is a Thin Kumo that is formed in an Uptrend condition. The picture also shows that the Price Chart is moving closer to the Thin Kumo and even entering the Thin Kumo which identifies that the Trend is starting to weaken and has the potential for a Twist to occur on the Kumo. This also indicates that the Price Chart may move down in the near future and the potential for a trend reversal from Bullish to Bearish is getting bigger. But in 75% of cases, the market becomes Sideways after a Twist is formed.
- Downtrend
Based on the price chart above, it can be seen that there is a Thin Kumo formed in a downtrend. The picture also shows that the Price Chart is moving closer to the Thin Kumo and even entering the Thin Kumo which identifies that the Trend is starting to weaken and has the potential for a Twist to occur on the Kumo. This also indicates that the Price Chart may move up in the near future and the potential for a trend reversal from Bearish to Bullish is getting bigger. But in 75% of cases, the market becomes Sideways after a Twist is formed.
Determine Resistance and Support Levels
- Uptrend
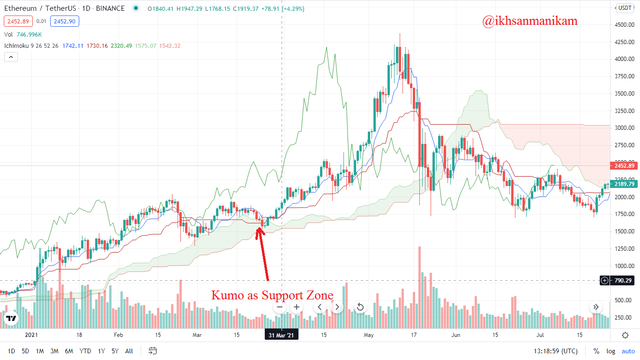
Based on the price chart above, it can be seen that Kumo is below the Price Chart because this is an Uptrend phase so that Kumo can function to identify a Support zone and it can be seen as in the picture above.
- Downtrend
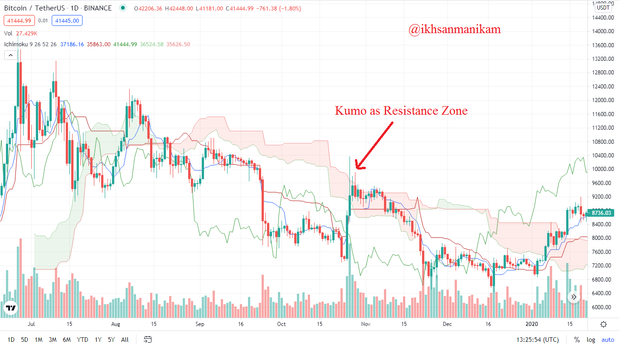
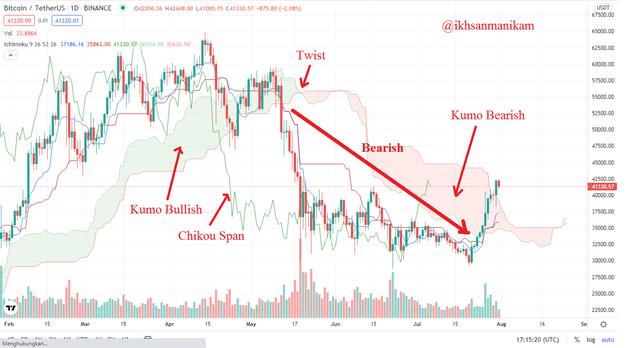
Based on the price chart above, it can be seen that Kumo is above the Price Chart because this is a Downtrend phase so that Kumo can function to identify a Resistance zone and it can be seen as in the picture above.
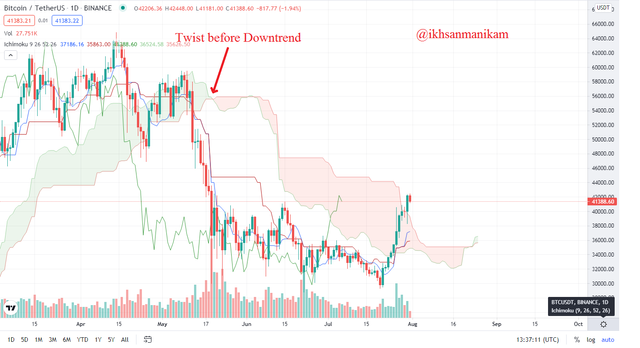
Q3.) How and why is the twist formed? And once we've "seen" the twist, how do we use it in our trading? (Screenshot required)
Twist is formed when the Senkou Span A line and the Senkou Span B line cross each other which indicates that the Trend is starting to weaken and and maybe a trend reversal can occur in the near future. But in 75% of cases, the market becomes Sideways after a Twist is formed.
Uptrend
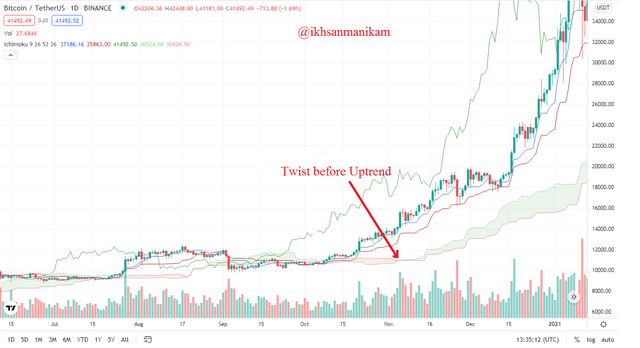
On the price chart, it can be seen that the Senkou Span A line managed to cross the Senkou Span B line and started moving upwards, thus encouraging the Uptrend to occur after some time in the future.
Downtrend
On the price chart, it can be seen that the Senkou Span B line managed to cross the Senkou Span A line and started moving downwards, thus encouraging a Downtrend.
Twist in Trading
Twist is one of the important elements that need to be considered in using the Ichimoku Kinko Hyo Indicator because Twists usually tell us that a potential reversal is starting to appear and we need to prepare what action we should take next. But first, we should wait for some time to see if the trend reversal has really started or not, because usually the market will experience Sideways before the trend reversal occurs. When a trend reversal occurs then we need to look at the lower point to buy the asset and sell it at the higher point when the price chart is about to break through the Kumo. This strategy is very suitable for short-term trading.
Q4.) What is the Ichimoku trend confirmation strategy with the cloud (Kumo)? And what are the signals that detect a trend reversal? (Screenshot required)
There are three trends that need to be considered to confirm the trend, namely Bullish, Sideways (Neutral), and Bearish. The two Senkou Span lines play an important role in the use of this indicator, but the neutral trend also needs to be considered in this case, because it is possible that the movement of the two lines does not create a Bullish or Bearish trend and only appears Sideways. That's why we need to confirm the trend, here are the confirmations of a different trend.
Uptrend (Bullish)
The Senkou Span A line is above the Senkou Span B line, the Kumo is moving up, and the price chart is above the Kumo.
Downtrend (Bearish)
Senkou Span A line is below Senkou Span B line, Kumo is moving downwards, and the price chart is below Kumo.
Netral (Sideways)
Senkou Span A line and Senkou Span B line are leading alternately in a short time interval and moving horizontally to the right, there is no strong trend here and the price chart is between Kumo shading. Usually this indicates that the market is going through an Accumulation phase and we can't see when the next trend will start, we just need to monitor it.
How to Detect Reversal Trend
In addition to confirming the trend, we also need to know what are the signals that can indicate a trend reversal and here are some things to pay attention to.
Twist, is one of the things that can indicate a trend reversal, when the two Senkou Span lines cross which indicates a weakening trend, then the potential for a trend reversal may occur in the near future. If the Senkou Span A line crosses the Senkou Span B line downward at Peak Bullish, the potential for a trend reversal to become Bearish will be even greater, and vice versa.
Movement Price, can also be taken into account to identify trend reversals. After the Twist occurs, usually the price chart will move through the Kumo and to identify the trend, we need to wait whether the price chart penetrates the top of the Kumo or vice versa and there will be Support and Resistance that will appear here.
Chikou Span, is another line that can be used as a reference in this case. When this line breaks through the Kumo and moves in a certain direction, a trend reversal will potentially occur in the near future. If this line moves downwards after breaking through the Kumo, then it is potentially bearish and vice versa.
Kumo Direction, is another consideration to look at after a Twist and we need to look at the Senkou Span A or B line above to confirm a trend reversal and then see where the Kumo is going, up or down. If the direction of Kumo moves upwards, then it is potentially bullish and vice versa.
Q5.) Explain the trading strategy using the cloud and the chikou span together. (Screenshot required)
Chikou Span is a line that shows a price picture based on the last 26 periods that can be used to detect trend reversals while Kumo is the space that forms between the Senkou Span A line and the Senkou Span B line plotted against the next 26 periods based on data from the last 9 to 52 periods. Then how is the combination of the two in a trading strategy? Here I will explain it based on Uptrend and Downtrend conditions.
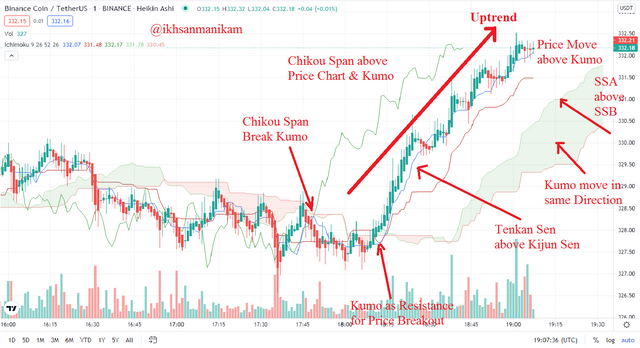
Uptrend (Bullish)
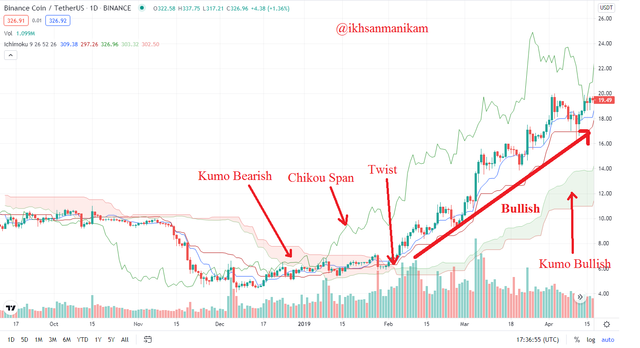
After the Chikou Span line broke through the Kumo Bearish & Price Chart in the previous period and then this line started moving upwards towards the Uptrend, the Chikou Span line was also above the Price Chart & the Kumo Bullish, supported also by the formation of a Twist, this indicates that the market potentially going to be bullish. To strengthen this assumption, we should wait until the next 26 candlesticks form and see if this condition persists or not. If these conditions persist, then we can decide to enter the market and then exit when the market has reached the Resistance zone to get enough profit.
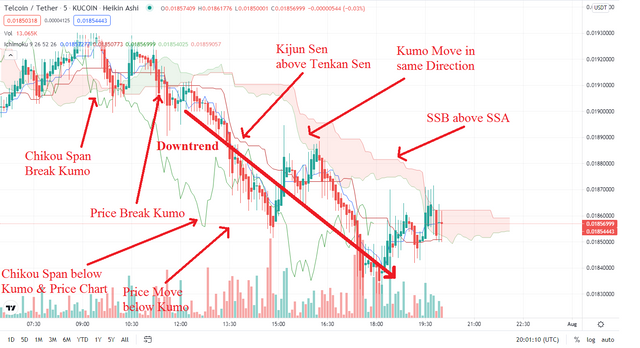
Downtrend (Bearish)
After the Chikou Span line broke through the Kumo Bullish & Price Chart in the previous period and then this line started moving downwards towards the Downtrend, the Chikou Span line was also under the Price Chart & Kumo Bearish, supported also by the formation of a Twist, this indicates that the market potentially going to be bearish. To strengthen this assumption, we should wait until the next 26 candlesticks form and see if this condition persists or not.
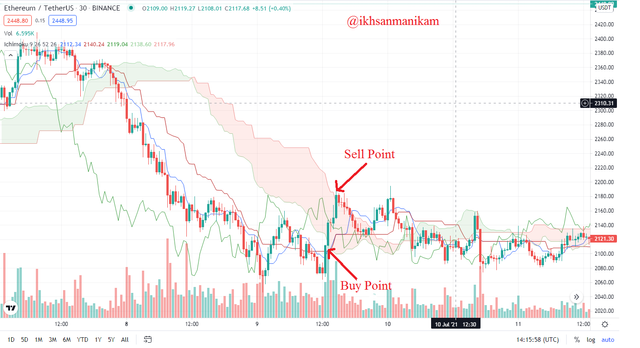
Q6.) Explain the use of the Ichimoku indicator for the scalping trading strategy. (Screenshot required)
Scalping is trades that are made in very short timeframes, ranging from 1 minute to 15 minutes and traders typically use 1 minute, 5 minute and 15 minute periods. The purpose of this trade is to accumulate profits gradually (bit by bit) with a low risk of trend reversal and reduce the potential for large losses.
The thing to note in this case is the use of a short timeframe and the 1 minute timeframe is a timeframe that is often used in "Ichimoku Scalping". To see a bigger impact in the future, we also need to consider the signals given on the 5 minute timeframe and 15 minute timeframe. The following is the use of the Ichimoku Indicator in Scalping Trading based on two different trends, namely Bullish and Bearish.
Uptrend (Bullish)
Downtrend (Bearish)
Determining good entry and exit points is very important when doing Scalping Trading and with the help of the Ichimoku Indicator we may be able to maximize profits for the better. In doing Scalping Trading using the Ichimoku Indicator, we must pay attention to several conditions that must be met in each trend. When these conditions have been met as in the two Price Charts that I show above, it means that it is a signal indicating that currently we can run Scalping Trading on each of these trends. Also make sure that you have determined your Stop Loss and Take Profit in each case you run.
Indicators were created to facilitate and assist traders in analyzing the market, one of which is using the Ichimoku Kinko Hyo Indicator. By using indicators like this, we can analyze the market technically so that we can make decisions with full consideration. This is of course to minimize the potential for losses in the market.
The Ichimoku Kinko Hyo Indicator is a complex indicator and we can use it to identify market conditions such as price momentum, market trends, trend reversals, support levels, resistance levels, sideways and others. I see that they can be predicted more accurately using this indicator than using traditional indicators. Thank you professor for this week's useful lesson.
Hello @ikhsanmanikam,
Thank you for participating in the 5th Week Crypto Course in its third season and for your efforts to complete the suggested tasks, you deserve a 6/10 rating, according to the following scale:
My review :
Acceptable work in which you tried to answer the questions in your own way and I have a few points I want to raise:
You provided a set of information to explain the Ichimoku cloud and its lines, but it lacks a methodology and an arrangement of ideas.
As for determining the levels of support and resistance based on the Ichimoku cloud, it differs from the traditional method, and this is what you are asked to interpret.
The third question could have been more in-depth in analyzing some aspects. It seems that you did not diligently search for what is required.
Thanks again for your effort, and we look forward to reading your next work.
Sincerely,@kouba01
Thank you for your spesific review my Professor. I Will better for next time.