Steemit Crypto Academy Season 3 Week 7 | Homework Post for Professor @kouba01 - Average Directional Index (ADX)

Assalamualaikum and good night everyone, tonight I will write a post about the ADX Indicator as my homework post for professor @kouba01. The professor has explained about ADX in this shared learning post and now it's time for students to finish the homework, there are six main questions to be asked in this homework and I will try to answer them. I am very enthusiastic to start because this is a new knowledge for me.

Q1.) Discuss your understanding of the ADX indicator and how it is calculated? Give an example of a calculation. (Screenshot required)
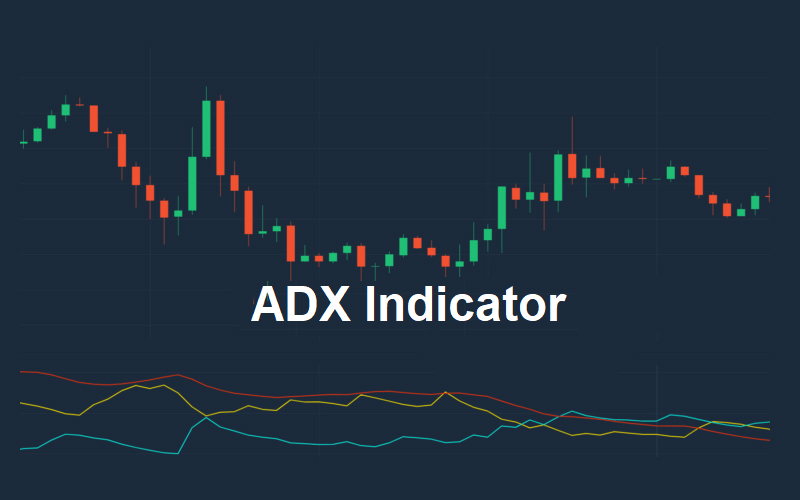
There are two main trends that are generally identified in the market by traders, namely Uptrend or called Bullish and Downtrend or called Bearish, while markets without a trend or moving flat to the right side are usually called Sideways. Of the two main trends (Bullish & Bearish), we also need to identify how strong the current trend is, whether it is weak or strong. For that, we can use the ADX Indicator because the main purpose of the ADX Indicator is to show the strength of a trend that is happening in the market, be it Bullish or Bearish.
By knowing the strength of a trend that occurs in the market, you can more easily determine what actions and strategies we will take for your trades, with better accuracy of course. That way you can also decide when to enter and when to exit the market because we have to be at the right time, both to determine the right time for Buy orders and Sell orders.
To show the strength of the trend, both Bullish and Bearish, the ADX Indicator will interpret it in the form of a 0-100 value scale with details of different categories. The value scale is grouped into 4 categories, 0-25 is weak trend or without trend, 25-50 is strong trend, 50-75 is very strong trend, 75-100 is extremely strong trend. The number 25 is the main value that shows the transition condition because it is between trend and non-trend. In order to provide better identification for traders, ADX Indicator is usually combined with DI+ and DI-, I will discuss this in the next question.
Simulation How to Calculate ADX
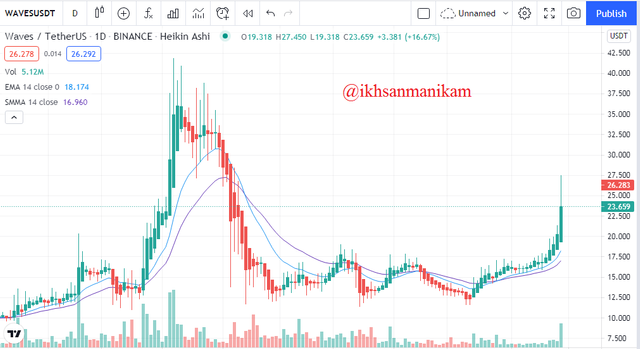
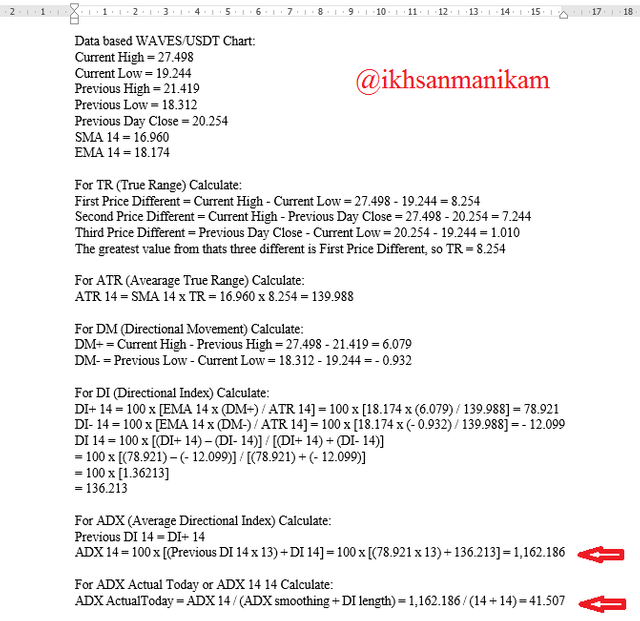
Data based WAVES/USDT Chart:
Current High = 27.498
Current Low = 19.244
Previous High = 21.419
Previous Low = 18.312
Previous Day Close = 20.254
SMA 14 = 16.960
EMA 14 = 18.174
For TR (True Range) Calculate:
First Price Different = Current High - Current Low = 27.498 - 19.244 = 8.254
Second Price Different = Current High - Previous Day Close = 27.498 - 20.254 = 7.244
Third Price Different = Previous Day Close - Current Low = 20.254 - 19.244 = 1.010
The greatest value from thats three different is First Price Different, so TR = 8.254
For ATR (Avearage True Range) Calculate:
ATR 14 = SMA 14 x TR = 16.960 x 8.254 = 139.988
For DM (Directional Movement) Calculate:
DM+ = Current High - Previous High = 27.498 - 21.419 = 6.079
DM- = Previous Low - Current Low = 18.312 - 19.244 = - 0.932
For DI (Directional Index) Calculate:
DI+ 14 = 100 x [EMA 14 x (DM+) / ATR 14] = 100 x [18.174 x (6.079) / 139.988] = 78.921
DI- 14 = 100 x [EMA 14 x (DM-) / ATR 14] = 100 x [18.174 x (- 0.932) / 139.988] = - 12.099
DI 14 = 100 x [(DI+ 14) – (DI- 14)] / [(DI+ 14) + (DI- 14)]
= 100 x [(78.921) – (- 12.099)] / [(78.921) + (- 12.099)]
= 100 x [1.36213]
= 136.213
For ADX (Average Directional Index) Calculate:
Previous DI 14 = DI+ 14
ADX 14 = 100 x [(Previous DI 14 x 13) + DI 14] = 100 x [(78.921 x 13) + 136.213] = 1,162.186
For ADX Actual Today or ADX 14 14 Calculate:
ADX ActualToday = ADX 14 / (ADX smoothing + DI length) = 1,162.186 / (14 + 14) = 41.507
With Picture (MS Word):
Result Comparison:
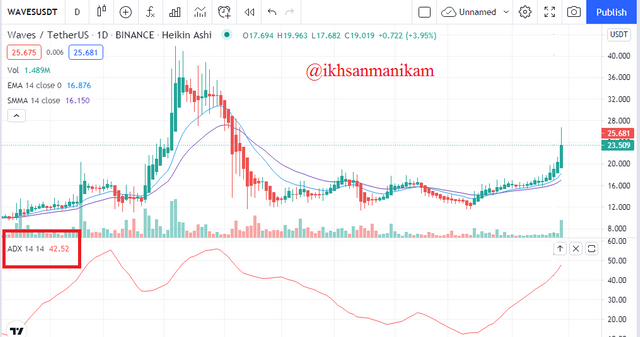
Based on the picture, it is evident that the results of my calculations to determine the value of ADX Actual Today or ADX 14 14 are close to the target. The result of my calculation is 41,507 while the result shown on the graph is 42,520. This proves that my calculations are almost accurate and the accuracy reaches 97.6%. Based on the ADX value, traders can find out that the WAVES/USDT trading pair currently has a strong trend because it has an ADX value above 25.
Q2.) How to add ADX, DI+ and DI- indicators to the chart, what are its best settings? And why? (Screenshot required)
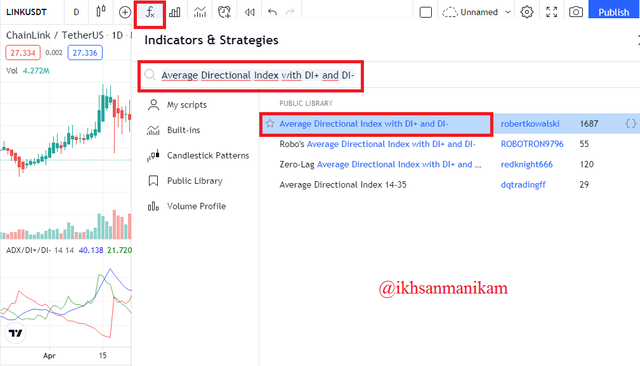
To add an indicator to a chart is not difficult, you just need to follow a few simple steps below. I will give an example through the TradingView platform https://www.tradingview.com/chart/
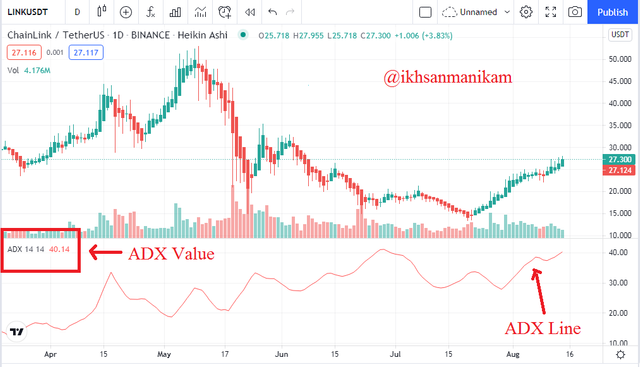
- After entering the Chart page you have chosen (ex: LINK/USDT), then select the “Fx” symbol at the top of the page. Then write “Average Directional Index with DI+ and DI-” in the search field and click the appropriate option. See the following image.
- Then close the pop-up menu because the indicator has been automatically added to the chart and the chart display will change to something like the image below.
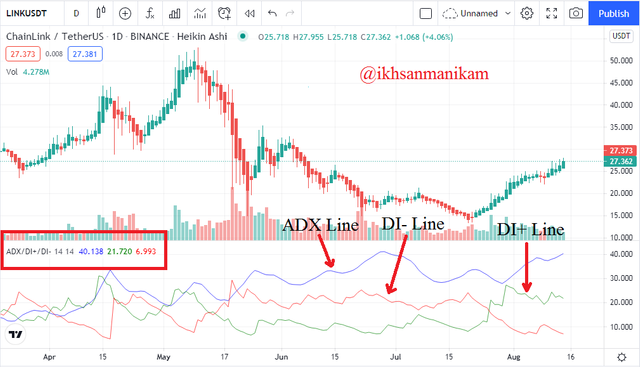
You can also set various other configurations according to your needs, you just need to click the “gear” symbol on the indicator. But on the display I did not change anything from the configuration because the default mode provided was good enough for me and suited my needs. The color difference of the line consists of blue for ADX, green for DI+ and red for DI- with the number of periods for ADX Smoothing and DI Length is 14 periods.
The main configuration to consider in this case is the number of periods because traders will choose different periods according to their trading needs. Period 14 is the most used period and is considered the default mode because it is the period that some traders consider realistic. According to some sources, the use of ADX should not use a time period below 7 or above 30 because the best choice is between 7-30.
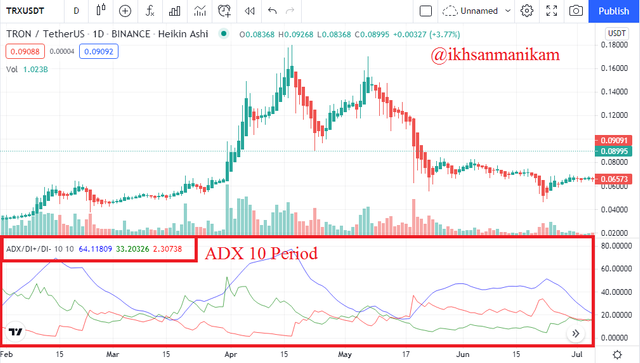
However you can also consider using a higher period (ex: 20 period) or a lower period (ex: 10 period) because traders with different trading styles will choose different periods. Traders who run scalping trading will usually consider using a lower period while for swing trading traders will usually use a higher period. The following two images will show the differences between the two periods.
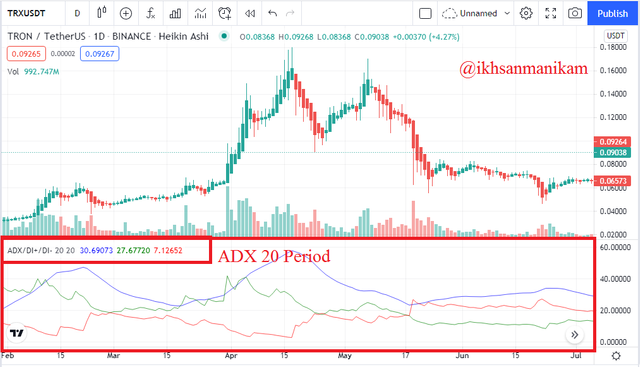
From these two different periods we can identify that the higher period (20 periods) indicates that price movements against changes that occur in the trend tend to give signals that look slower with lower volatility over a longer timeframe and thus some Small trends that are less influential will certainly be ignored so we can focus more on seeing the really strong trends.
Whereas in a lower period (10 periods) it shows that price movements to changes that occur in trends tend to give signals that look faster with higher volatility in a shorter time span and thus there will be many trends that appear here so that sometimes the signal shown is not completely correct. It can be said that the ADX with 20 periods proved to be smoother than the ADX with 10 periods.
Of the various options, then which is the best period? I think it's a relative thing and it depends on the needs of each trader based on the strategy and trading style being carried out, because I tend to do Swing trading so I prefer to use higher periods, I will choose periods in the range 14 to 22.
Q3.) Do you need to add DI+ and DI- indicators to be able to trade with ADX? How can we take advantage of this indicator? (Screenshot required)
ADX is an indicator used to measure the strength of the trend so that the ADX value will tend to go up and down to adjust to the current trend conditions. Meanwhile, DI+ and DI- are indicators that show Bullish and Bearish momentum, DI+ for Bullish and DI- for Bearish. Meanwhile, by measuring the high and low during a certain period, the market direction will be indicated by the DMI and we can identify it based on DI+ and DI-, when DI+ is above DI- then it means the price is rising and ADX will measure the strength of the Uptrend, vice versa.
By adding DI+ and DI- to the ADX indicator, of course this becomes a more complete combination and makes the indicators we use more accurate and specific even though it doesn't mean 100%. This addition supports and complements the indications we need in this case so that traders can see the indications that appear more clearly and confirm them with the correct identification.
Q4.) What are the different trends detected using the ADX? How to filter out the false signals? (Screenshot required)
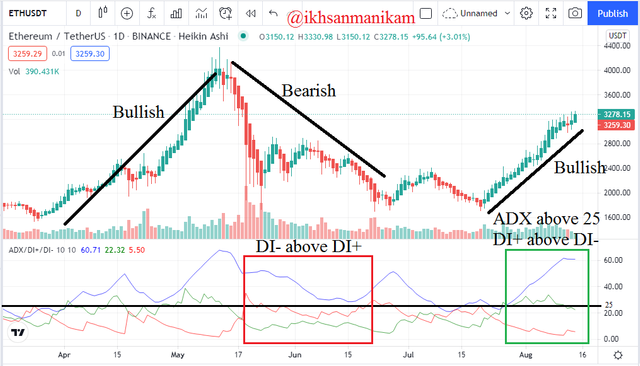
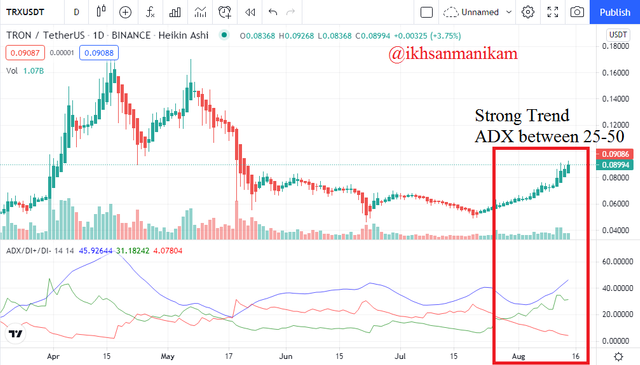
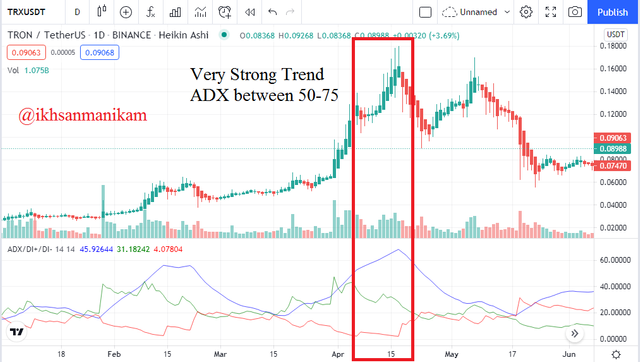
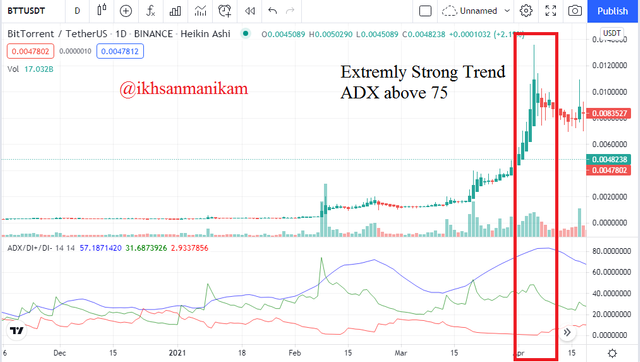
There are 4 trend categories that can be identified using the ADX indicator, both in bullish and bearish conditions. The four categories are 0-25 is weak trend or without trend, 25-50 is strong trend, 50-75 is very strong trend, and 75-100 is extremely strong trend. Here are some examples of these categories that I took in several cases.
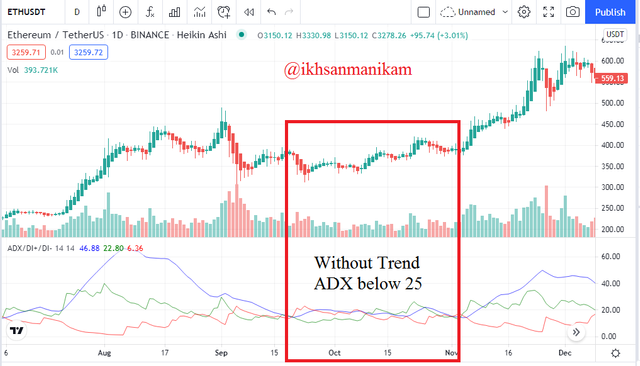
Although overall ADX works according to theory, sometimes false signals may appear so traders should be more careful in understanding them. Actually this is a misunderstanding, because ADX is an indicator that indicates the strength of the trend, not the direction of the trend. Although in many cases these are two things that are directly proportional, there are also opposites in some cases, as in a case in the following picture.
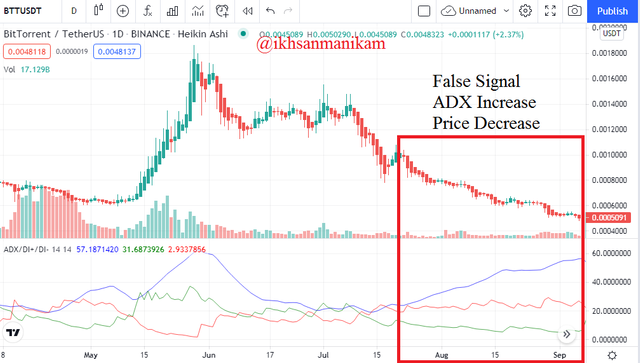
Based on the picture, it can be seen that ADX has increased while the chart has decreased, this shows that the sentence ~when ADX goes up, the graph will also go up~ it can't always be confirmed because ADX only serves to measure the strength of the trend and ADX in this case only indicates that trend strength is strong. Therefore, we need to understand it properly and always think realistically. To make sure it is more accurate, traders can also combine it with other indicators so that traders can make a comparison in deciding the results of an analysis. It should also be remembered that a trend will have strength if the ADX value is above 25.
Q5.) Explain what a breakout is, How to use the ADX filter to determine a valid breakout? (Screenshot required)
Based on a number of charts, we can find cases of Breakout in Bullish or Bearish trend conditions. In the Bullish market, Breakout occurs when the price breaks through the resistance point that was formed in the previous Bullish phase and then the price moves up away from the resistance point for a certain time until a new resistance point is reached, while Breakout in the Bearish market occurs when the price fails to maintain its position to does not break the support point that was formed in the previous Bearish phase and then the price moves down away from the support point for a certain time until a new support point is reached.
In this case, apart from being used to identify trend strength, ADX can also be used to determine a Breakout and traders need to understand it carefully to determine whether it is fake or not. The value of 25 on the ADX scale is a measure of whether or not the trend strength starts, because this is the point of transition. But sometimes the breakout occurs when the trend is not strong or the ADX value is still below 25 and it turns out to be a fake breakout, so we need to identify it properly. Here is an example of a fake Breakout.
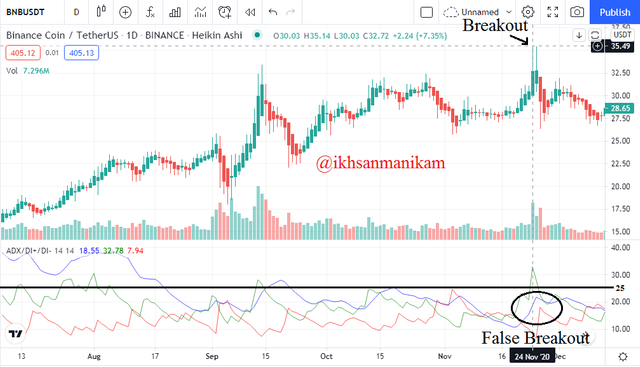
Based on the picture, it can be seen that the ADX value is still below 25, while the price chart seems to be starting to move for a breakout. But it turned out to be a fake breakout because the price did not seem to continue its movement and even started showing a decline after that. In addition to seeing that the ADX value is still below 25, traders also need to install additional indicators to determine whether the Breakout really occurred or not. It should also be remembered that anything that happens below the value of 25 is not strong and this condition is very risky for us to make decisions, so we should wait first. For comparison, here is an example case that shows Breakout is valid.
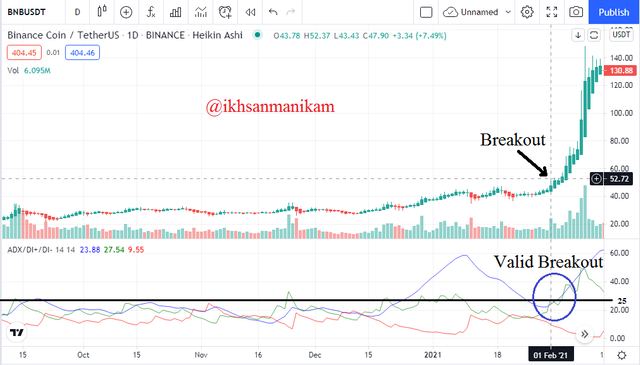
The image clearly looks different from the previous image. In the picture it can be seen that the Breakout occurs when the ADX value is above 25 and this can be considered a valid Breakout. The breakout also proved valid because the price chart managed to show the continuation of its movement after the breakout and moved towards a new resistance point.
Q6.) What is the difference between using the ADX indicator for scalping and for swing trading? What do you prefer between them? And why?

Scalping is a trade that tends to be carried out in shorter time periods (1 minute, 5 minutes, 10 minutes, or 15 minutes) to collect profits gradually (bit by bit) by performing several operations in and out whereas Swing trading tends to be carried out in longer time periods (a few days or a few weeks).
The ADX Indicator can be used on any trade, including Scalping and Swing Trading. However, in my opinion ADX is more suitable for use in Swing Trading because it uses a time frame that tends to be longer so that the strength of the trend can be identified with better accuracy and avoid false indications. The use of ADX on time frames that tend to be shorter as in the case of scalping has the potential to create many trends and some of them may appear with a number of false indications so scalping traders should be aware of this by installing additional indicators for comparison.
By using the ADX Indicator, traders can find out the strength of a trend that is happening in the market based on a scale of 0-100 and this is very helpful for traders in making decisions for the trades they make. It is also important for traders to determine the best ADX period according to them and they can set it according to their trading needs. I think ADX Indicator is more suitable for use in Swing Trading.
The addition of DI+ and DI- to the ADX Indicator is also a very good combination because then traders can identify trend strength and signal the direction of the trend at the same time. This indicator will be more effective when combined with various other indicators such as MACD, RSI, ATR, Ichimoku, etc. Thank you professor @kouba01 for giving me new knowledge this week with very interesting and very useful material. See you...
Hello @ikhsanmanikam,
Thank you for participating in the 7th Week Crypto Course in its third season and for your efforts to complete the suggested tasks, you deserve a 9.5/10 rating, according to the following scale:
My review :
Excellent work which covered the subject in all its aspects in a superb manner and with a solid methodology. Most of the answers were precise and direct.
A good and deep explanation of ADX indicator with a great effort to interpret its complex method of calculation.
In the last question, your answer was general as you did not go into details and did not provide some illustrative examples.
Thanks again for your effort, and we look forward to reading your next work.
Sincerely,@kouba01
Good post https://9blz.com/adx-indicator-explained/