Introduction to Crypto Analysis Principles - Crypto Academy / S4W7 - Homework Post for Professor @imagen

Assalamualaikum and good morning everyone, welcome to the Steemit Crypto Academy season 4. Today I will write a post about Introduction to Crypto Analysis Principles as a homework post for professor @imagen and this is my tenth post in this season. The professor has explained the Introduction to Crypto Analysis Principles in the learning post that has been distributed to this community and now it's time for students to finish the homework that has been given, there are five main questions that must be answered in this homework and I will try to answer them in this post. Let’s go...

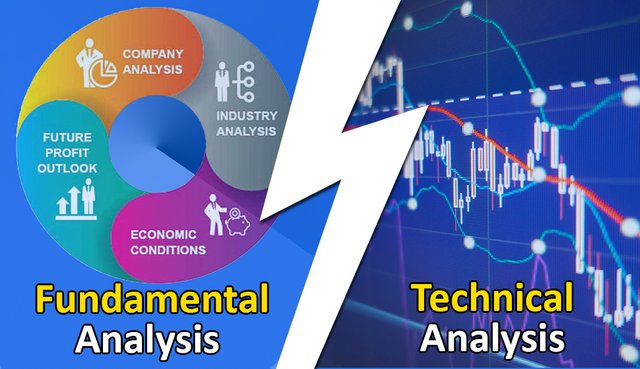
Q1.) What is the difference between Fundamental Analysis and Technical Analysis? Which one is used most often?
- Fundamental Analysis is an analysis used to determine the quality of the relative value of an asset based on a certain amount of information which generally consists of Project objectives, Financial Metrics, and On-Chain Metrics while Technical Analysis is an analysis used to predict the price of an asset based on a number of information certain things found on the price chart, such as patterns of formation, price movements, volume, trends, volatility, momentum, and the use of indicators-tools.
- If traders can apply them simultaneously, Fundamental Analysis and Technical Analysis will produce an analytical decision with a greater potential for success.
- If not applied simultaneously, Fundamental Analysis is more suitable for investment purposes while Technical Analysis is more suitable for trading purposes.
- Fundamental Analysis can assist traders in identifying fraudulent projects while Technical Analysis can assist traders in determining good entry and exit points.
- Fundamental Analysis does not require special skills in its use because you only need to collect as much project information as possible while Technical Analysis tends to require special skills because you have to identify the market based on a number of indicators-tools that need to be studied first.
- Fundamental Analysis tends to study the things that cause market price movements while Technical Analysis tends to study their effects.
- Fundamental Analysis only uses a number of data as a source of information while Technical Analysis uses a number of data to perform various technical calculations on various indicators.
- Fundamental Analysis only uses qualitative & quantitative information data while Technical Analysis relies on price movements on charts and indicators-tools.
- Fundamental Analysis considers what prospects may be developed by a project in the future while Technical Analysis only considers historical price data to predict the price of an asset in the future.
If asked which analysis is more often used, Fundamental Analysis or Technical Analysis, then I will answer that it is very relative because every trader has different considerations and experienced traders will usually use both types of analysis in every trade. They usually use Fundamental Analysis as an initial consideration in determining what assets are good for investment and when they have chosen a particular asset then they will use Technical Analysis to determine the right entry and exit points so that their trades can be of higher quality in maximizing profits.
Q2.) Select one of the following crypto assets and perform a Fundamental Analysis showing the Project objectives, Financial Metrics and On-Chain Metrics. You can select Cardano (ADA), Solana (SOL), Terra (LUNA), Chiliz (CHZ), or Polkadot (DOT). And I will choose Polkadot (DOT)
A. Project Analysis

The Polkadot project was created by one of the founding members of Ethereum and his two colleagues who have some great experience in the blockchain world and these guys are Gavin Wood, Robert Habermeier, and Peter Czaban. The project which was developed from 2016 to 2020 by the Swiss-based Web3 Foundation is a highly scalable and secure operable network protocol that allows transfers between blockchains of any type. Polkadot also has a native token that has been very actively traded on a number of cryptocurrency exchanges and the token is called DOT. The DOT token has three distinct purposes, namely as network governance, staking, and bonding.


This becomes one of the great innovations of course because it can solve the scalability problem that is generally found in a number of blockchains due to the fact that each blockchain operates separately from its own system so they cannot be connected to each other. As a Multi Blockchain platform, the Polkadot network is designed to be able to offer solutions to the scalability problems that have occurred so far in a number of blockchains and can make communication between all existing external blockchains more active of course. The Polkadot network can connect multiple chains in one network and then process each transaction in parallel making it possible to process more transactions in the same time period.
Polkadot has a very active and growing ecosystem, various companies have also collaborated and currently there are dozens of projects running on this network. Polkadot is built on the Substrate protocol which allows developers to create blockchain projects. With the Substrate protocol, developers will have highly compatibility projects because each Polkadot-based project can communicate, transact, and transfer data with various other external projects. In addition, Polkadot is also Forkless and Future-Proof in integrating new features or fixing bugs because Polkadot can upgrade without hard forks so that new versions are more compatible and can be easier to adapt with various changes.
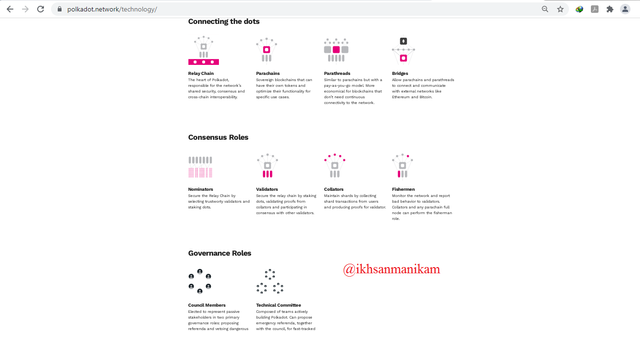
This network has been designed in a fragmented manner into many components with different functions and has different separate chains called Parachains. Each Parachain has its own blockchain with different functions and has its own token so Polkadot is called multiple blockchains in one blockchain. In the Polkadot ecosystem, each Parachain can connect to other networks through the main Polkadot blockchain called Relaychain and Parachain is a parallel blockchain as a branch of Relaychain which serves to avoid Relaychain saturation. Each Parachain can also communicate with other external chains such as Bitcoin and Ethereum via a special blockchain called Bridges.
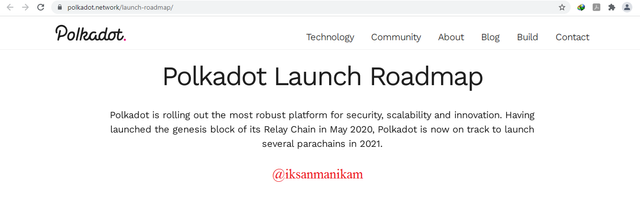
Every project that wants to have access to Parachain then the project must first enter the auction to get a number of DOT tokens as a loan from a number of users who support the project so as to enable the project to get the highest bid. The new stage of the Parachain auction is planned to take place on November 11, 2021 and there are 100 Parachains to be executed. This of course can encourage the Polkadot network to become more and more developed because more and more projects will run on this network in the future and until now Polkadot and the DOT token continue to show very significant progress in various sectors and they continue to grow to be more powerful every day.
B. Financial Metrics
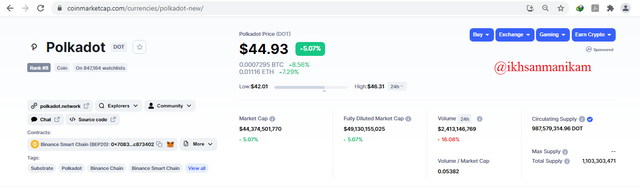
| Cryptocurrency | Polkadot (DOT) |
|---|---|
| Market Rank | 8 |
| Price | $ 44.93 |
| Low – High in 24h | $ 42.01 - $ 46.31 |
| Volume in 24h | $ 2,413,146,769 |
| Marketcap | $ 44,374,501,770 |
| All Time High | $ 49.69 May 15, 2021 |
| All Time Low | $ 2.69 Aug 20, 2020 |
| Circulating Supply | 987,579,314.96 DOT |
| Total Supply | 1,103,303,471 DOT |
| Market Dominance | 1.74% |
| Official Website | https://polkadot.network/ |
| Whitepaper | https://polkadot.network/PolkaDotPaper.pdf |
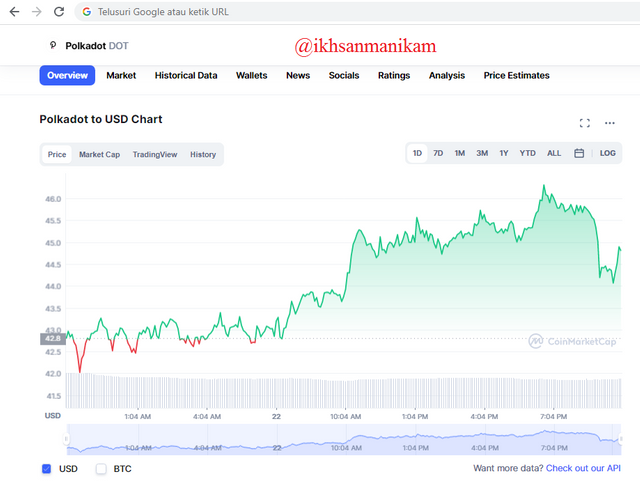
Currently the DOT token is becoming one of the prima donnas in the world of cryptocurrency trading because this token is in a very positive trend and the projects are also growing so that this token is increasingly being considered as an investment asset in cryptocurrency trading. Based on some of the data above, it can be seen that the DOT token is getting higher in all aspects and even the price is now almost reaching the ATH point that was reached last May. With market enthusiasm getting higher at the moment and market dominance continuing to increase, the DOT token has the potential to reach its ATH point again in a few days, we'll just have to wait.
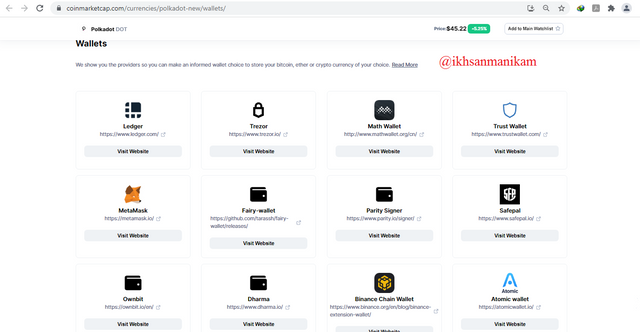
Judging from the wallets and security factors, traders also don't need to worry because DOT tokens can be stored easily and safely in a number of wallets such as Ledger, Trezor, MathWallet, TrustWallet, MetaMask, FairyWallet, ParitySigner, Safepal, Ownbit, Dharma, BSCWallet, and AtomicWallet.
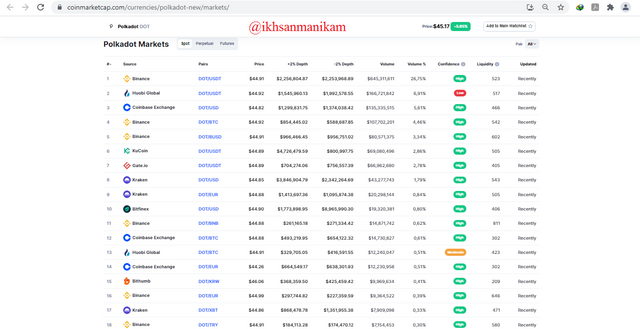
When viewed from market and trading factors, the quality of the DOT token is also unquestionable. The DOT token is currently traded on hundreds of crypto exchanges with high trading volume. The DOT token has also been traded with various trading pairs on various crypto exchanges so that traders can easily trade them.
C. On-Chain Metrics
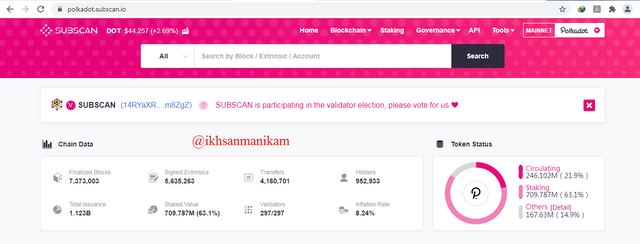
Currently the Polkadot network (DOT) has completed 7,373,003 Blocks with a total of 1,123 billion DOT tokens issued, while the number of Staked DOT is 709,787 million tokens or equivalent to 63.1% of the total issued tokens. The number of transfers that have been made to date is 4,160.701 and there are 297 Validators who play an active role in each of these transactions. The current number of DOT token holders is 952,933 users and please note that currently the DOT token inflation rate is only 8.24%. The current circulation of DOT tokens is 246,102 million tokens, equivalent to 21.9% of the total issued tokens, while the number of immovable DOT tokens currently stands at 167.63 million tokens or 14.9% of the total issued tokens.
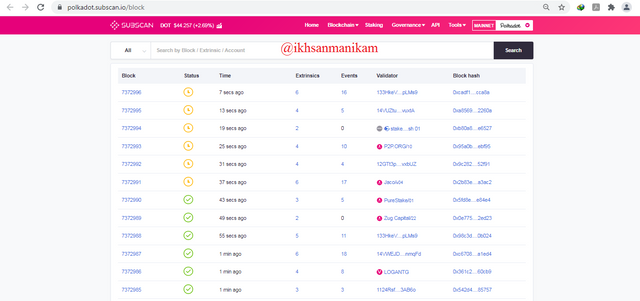
The image above shows a number of Blocks that have been formed so far and the last Block when this post made was 7372996 and click on the Block to see the details.
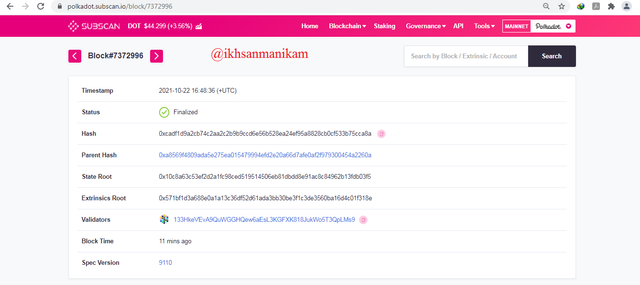
Based on the picture above, we can find out the details of the Block which contains a number of important information such as Timestamp, Status, Hash, Parent Hash, State Root, Extrinsics Root, Validators, Block Time, and Spec Version. That way, the public can also track various transactions to get various information easily and this proves that this network is very transparent.
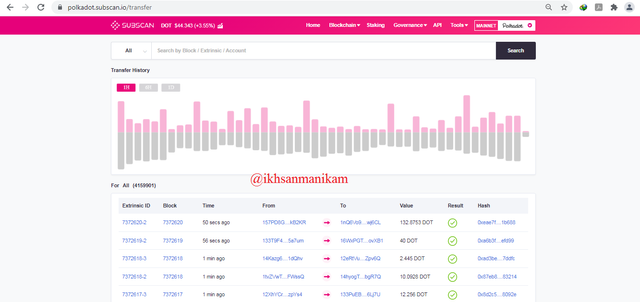
The current number of transactions has reached 4,159,901. Based on the image above, the public can also view the transfer history with a number of detailed information, such as Extrinsic ID, Block, Time, Sender Wallet Address and Recipient Wallet Address, Value, Result Status, and Hash Block.
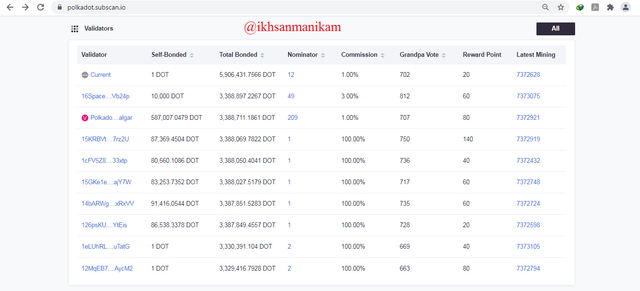
The public can also see a number of validators who continue to work hard and play an active role in every transaction process that occurs here. There are currently 297 Validators and all of them are active. Based on the image, the public can see a number of information related to the performance of Validators, such as Username Validators, DOT Self Bonded, DOT Total Bonded, Nominator, Commission, Grandpa Vote, Reward Point, and Latest Mining. With a number of agreed terms, all active Validators will get a number of Rewards based on their performance.
Q3.) Make purchases from your verified account at least 10 USD of the currency selected in the previous point. Explain the process. (Show Screenshot)
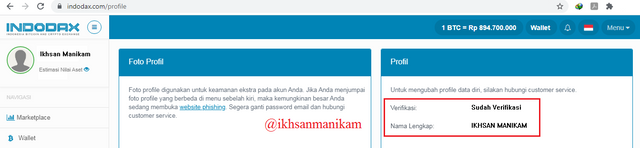
- In this section I will use one of the most popular exchange accounts originating from my country Indonesia, INDODAX https://indodax.com/ . The following is proof that my account has been verified on the Indodax platform.
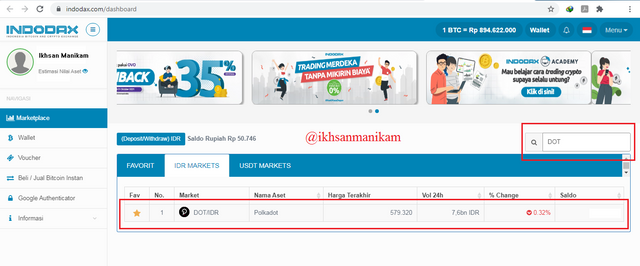
- Go to the trading page https://indodax.com/market , then write DOT in the search field and click the DOT/IDR trade icon that appears below it.
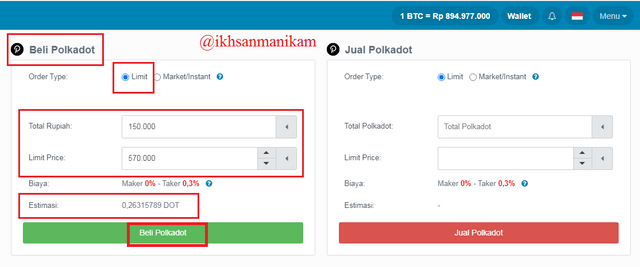
- Then the DOT/IDR trading screen will appear and scroll down the page to find the Buy & Sell menu options. I will buy a number of DOT using a capital of 150,000 IDR (equivalent to 10.6 USD). I will place a Buy Limit Order at 570,000 IDR/DOT and that way I will probably get 0.26315789 DOT. Then click Buy Polkadot (green button) to place the order.
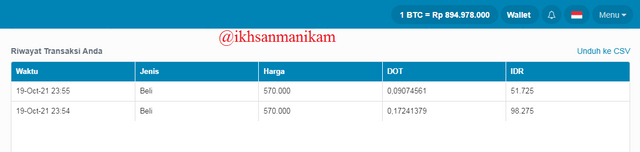
- Because I placed an order that was not too far from the market price, my order was successfully fulfilled in a not too long time and here is my purchase history.
- I can also see the amount of DOT I already have on the top of the DOT/IDR trading page as shown below.
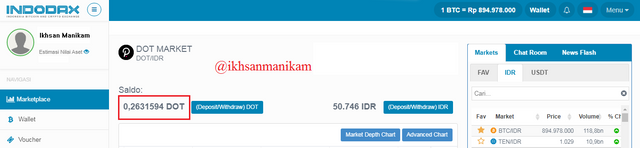
I have successfully purchased 0.2631594 DOT with a capital of 150,000 IDR (equivalent to 10.6 USD) using the Buy Limit Order feature on the INDODAX cryptocurrency exchange platform.
Q4.) Apply Fibonacci retracements to a pre-selected asset with a time frame of 4 hours on the platform of your choice. Observe price developments in 24 and 48 hours, does the value go up or down? Look to identify resistance and support levels. (Show Screenshots at 0, 24 and 48 hours of purchase where date and time are observed)
In one of the crypto classes mentored by professor Lenonmc21, I learned about the "Fibonacci Retracement + AB=CD Pattern" at the beginning of season 4 and here is the link:
And based on the lessons that I have learned, I will apply them to answer this question. I will combine Fibonacci Retracement with AB=CD Pattern because I think this method is more effective even though it doesn't mean 100% accurate.
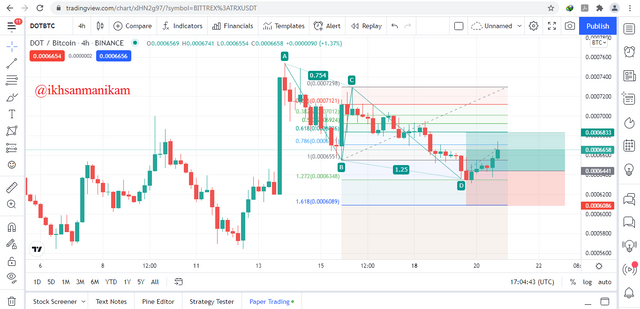
Because the professor wanted students to buy cryptocurrency, I tried to find the AB=CD Bullish Pattern and it turned out that the DOT/BTC chart with 4 hours timeframe really supported me in making this analysis.
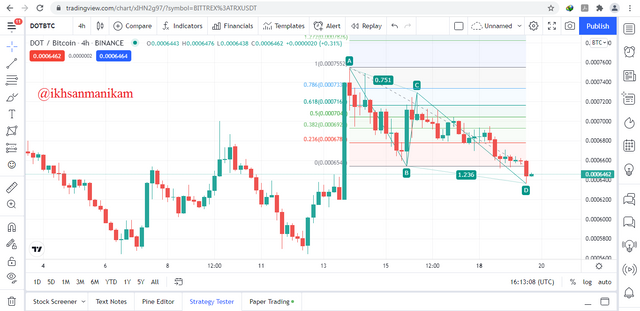
In the picture it can be seen that I have determined points A, B, C, and D to form the AB=CD Bullish Pattern and then combined it with the Fibonacci Retracement. There are two conditions that must be met in the picture, namely there is no candle that passes through point A or point B along AB line, while point C must be in a lower position than point A and between the levels of 61.8% & 78.6% Fibonacci Retracements of AB line.
Based on the picture, it can be seen that the market price has just broken through the 100% Fibonacci Retracements level from the BC line, point D is a Bearish Candle, and point D is also at the level of 127.2% Fibonacci Retracements from the BC line. All of these conditions have been met and thus it can be concluded that the market price movement in the next few days has the potential to be an Uptrend so that this becomes a signal for traders to place Buy Orders with a good stop loss configuration of course.
Then I decided to enter the market to place a Buy Order and I managed to buy a number of DOTs as I mentioned in the previous question. After that I set a Long Position with a Risk Ratio of 1:1. With details that my Stop Loss is at the level of 161.8% Fibonacci Retracements of the BC line and my Take Profit is at the level of 61.8% Fibonacci Retracements of the BC line.
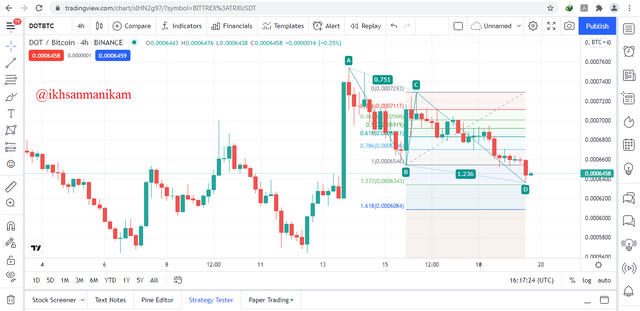
After 24 Hours
Based on the picture it can be seen that the price is moving up and is between the 100% & 78.6% Fibonacci Retracements of the BC line. For now the price movement seems to be going according to the results of the analysis and it is still necessary to wait in the next few hours to prove whether this analysis is correct or not. Green candles dominate the price movement and it indicates that the price has the potential to continue moving up until the Bullish actually occurs.
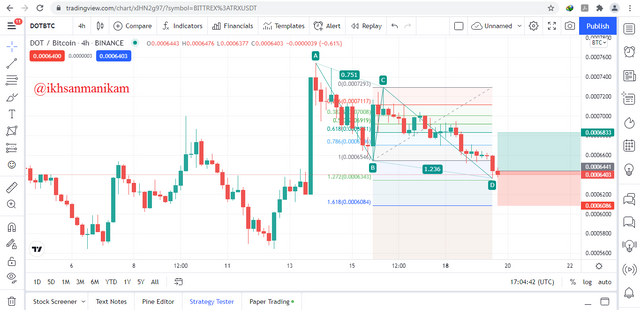
After 48 Hours
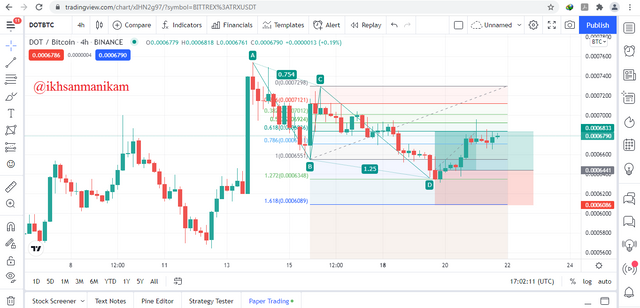
Finally I can say that my trade went well and my analysis was successful because my trade was successfully executed at the take profit level and even the market price broke through my Take Profit level before 48 hours. Based on the picture it can be seen that the market price has broken through the 61.8% level and 50% Fibonacci Retracements of the BC line. While the latest market conditions tend to move flat and I see that the market has the potential to continue its trend if the market price breaks through the 50% Fibonacci Retracements level from the BC line.
My Profit Proof from this Trading Operation
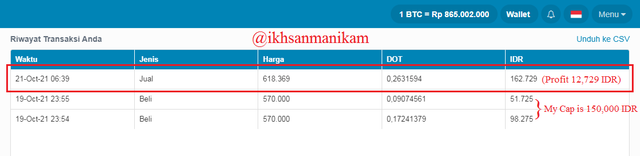
By doing a number of analyzes as I have described above, I decided to enter the market to buy 0.2631594 DOT at a price of 570,000 IDR/DOT with a capital of 150,000 IDR (equivalent to 10.6 USD). After waiting for about two days, finally my trade was successfully executed at the take profit level because the market moved according to the analysis and predictions that I had predicted. Based on the picture, it can be seen that I managed to make a profit of 12,729 IDR from the trade that I just ran.
Q5.) What are Bollinger Bands? How do they apply to Crypto Technical Analysis? With which other tool or indicator do you combine Bollinger Bands to analyze Crypto? Justify your answer
A. About Bollinger Bands and Configurations
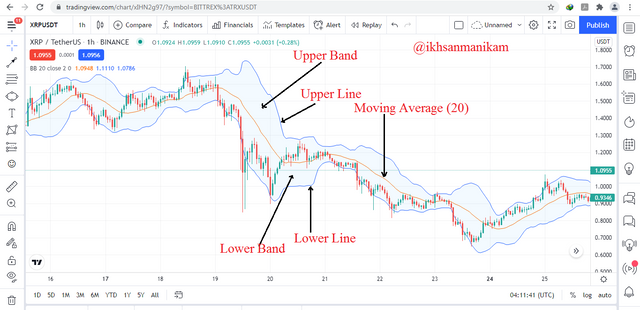
John Bollinger is the one who developed the Bollinger Bands indicator and this indicator has become one of the favorite indicators for most traders to date because this indicator is very helpful for traders in doing a number of technical analysis. The Bollinger Bands indicator can help traders identify various market conditions, such as Uptrend, Downtrend, Trend Reversal, Support, Resistance, Overbought, Oversold, Breakout, and Market Volatility. The Bollinger Bands indicator wraps the movement of candlesticks between two bands, namely the Upper Band and the Lower Band. In addition, the Bollinger Bands also have an Upper Line & Lower Line to determine a number of indications and also use the Moving Average Line as the middle line between the Upper Band and Lower Band.

The Bollinger Bands indicator has a number of configurations that can be adjusted based on the needs and trading strategies of the traders. However, John Bollinger suggests using a 20-day Moving Average with each standard deviation value for the Upper Band is 2 and for the Lower Band also 2. This means that the Upper Band is calculated by adding the Moving Average while the Lower Band is calculated by subtracting the Moving Average. In addition to these configurations, traders can also use other configurations such as a 10-day Moving Average with a standard deviation of 1.5 or a 50-day Moving Average with a standard deviation of 2.5.
B. How to apply Bollinger Bands indicator in Crypto Technical Analysis
Market Trend
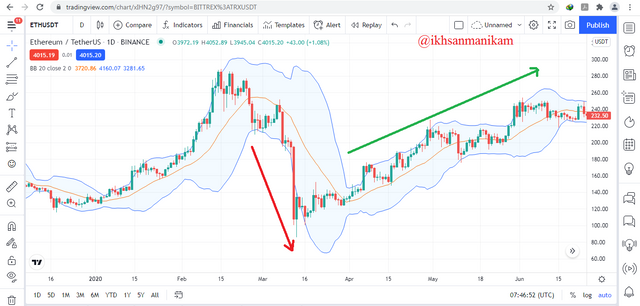
Together with the Moving Average contained in it, the Bollinger Bands indicator can provide a better picture of the ongoing trend in the market in a very simple way. When the trend goes up, the Bands also go up and when the trend goes down, the Bands also go down because Bands always move to wrap up price movements so traders can identify market trends well. As an initial consideration, it is important for traders to identify the market trend because trading should follow the market trend.
Trend Reversal
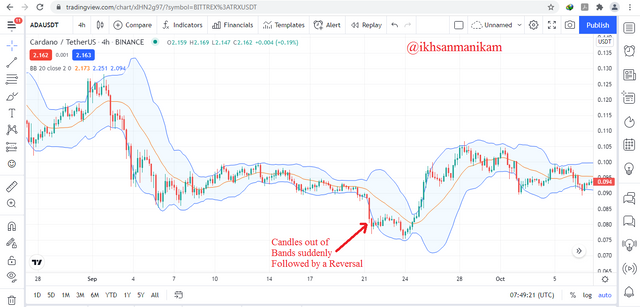
Based on the level of market volatility, the Bollinger Bands indicator can also identify trend changes and trend reversals. When market volatility rises dramatically, the market has the potential to experience a Breakout so that the candles will come out of the Bands and if there is more than one candle that is outside the Bands, the first candle that enters the Bands can be identified as a potential trend reversal.
Overbought & Oversold
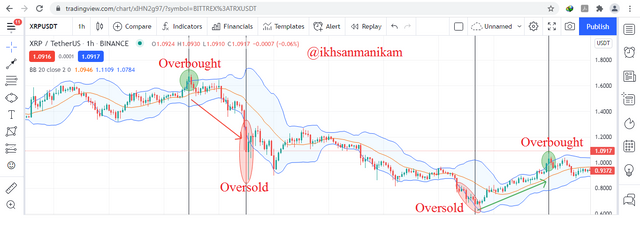
Bollinger Bands can also be used to determine the condition of the Overbought and Oversold area of an asset in a simple way. When the candles break through the Upper Band when the Band spread is relatively normal, it is considered Overbought, while when the candles break through the Lower Band when the Band spread is relatively normal, it is considered Oversold. Traders should place sell orders when Overbought and place buy orders when Oversold.
Support & Resistance
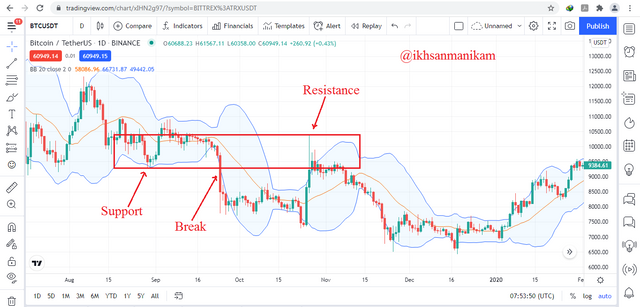
With Analysis tools, traders can also identify Support & Resistance based on the Moving Average contained in the Bollinger Bands indicator. In the picture it can be seen that the bounce point that occurs after the candles break through the Lower Band becomes a support point and then a break occurs when the candles break the support line and exit the Bands, while the resistance point occurs when the candles break through the Upper Band and pass the previous support point so that this becomes new resistance point.
Volatility
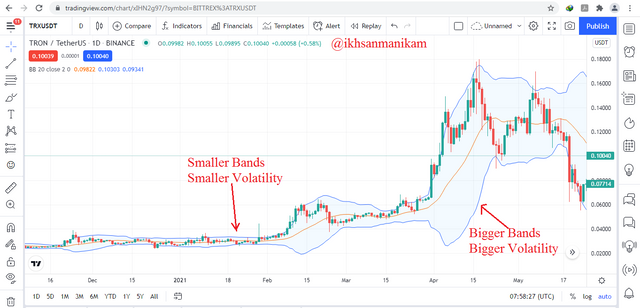
As one of the indicators based on volatility, Bollinger Bands can identify the high and low levels of market volatility with a simple concept, when the Bands are wider, the Volatility is higher and vice versa. Thin bands usually tend to form on a sideways market (without a trend) while thick bands usually tend to form on a trend market (uptrend and downtrend). Trading volume also greatly determines market volatility because low trading volume tends to reduce market volatility and vice versa.
Breakout
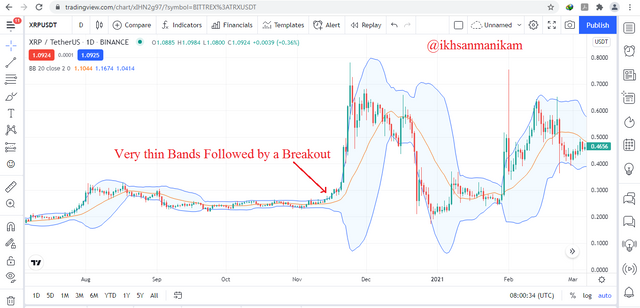
When the bands are getting thinner, this has the potential to break out and start a new trend because the volatility in the market is getting lower and the market usually has experienced a long accumulation phase. When the breakout actually occurs, the candles will come out of the Bands and then the Bands will also start to widen because the volatility starts to rise again. When tarders find thin bands in a market, traders may be able to monitor it for some time and when a breakout actually occurs, traders can take the opportunity to trade for big profits of course.
C. Combination of Bollinger Bands and RSI in Crypto Analysis
Although no indicator is 100% accurate, traders can combine a number of indicators based on the trading strategy carried out to confirm a signal and make a better decision of course because an indicator may give us false signals and in this section I will combine the BB indicator and RSI. RSI is a momentum-based indicator that is usually used to determine Overbought and Oversold conditions, an asset will be considered Overbought if the RSI value is above 70 and will be considered Oversold if the RSI value is below 30.
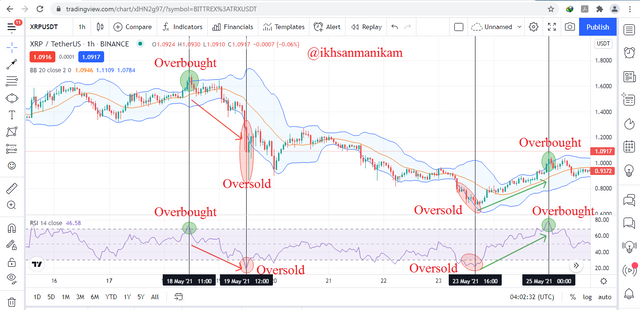
Although BB and RSI use different price data in their calculation mechanism, the Upper Band and Lower Band contained in the BB indicator can also be used to identify Overbought and Oversold conditions. Traders can use the RSI indicator to better confirm the Overbought and Oversold signals and prevent false signals of course. Based on the figure, it can be seen that the BB and RSI indicators can be combined well.
When the candles break through the Upper Band then it is considered as Overbought and the signal is also getting stronger because the RSI value is above 70 so that the signal can be confirmed as Overbought and traders can place sell orders to get some profit because the market price has the potential to drop after that. In addition, when the candles break through the Lower Band then it is considered Oversold and the signal is also getting stronger because the RSI value is below 30 so that the signal can be confirmed as Oversold and traders can place buy orders because the market price has the potential to rise after that. But in some cases, especially in a market with a strong trend, the market manages to continue its trend and does not reverse direction so traders need to use a stop loss ratio with a fairly good ratio on each trade.
Although no analysis is 100% accurate, Fundamental Analysis and Technical Analysis play an important role in every trading decision and experienced traders will always consider these two things because trading without analysis is a ridiculous gamble. Traders can perform Fundamental Analysis by considering Project objectives, Financial Metrics, and On-Chain Metrics to see the quality behind a particular asset. Apart from that, traders also need to do some Technical Analysis based on the trading style being carried out and traders can also consider certain indicators in this regard.
When using an indicator, traders are advised to use indicators that are relevant to the current trading strategy and to anticipate false signals, traders should also use several indicators as a combination so that traders can confirm whether a signal is good or not. With increasing experience it will make a trader have the ability to read charts better. A good technical analysis will determine the success of a trader because the right market entry and exit points are the main keys to success in trading. The cryptocurrency market is very volatile and that is a consequence so traders also need to adjust the risk ratio with the right stop loss level as a good trade management in minimizing risk.
Gracias por participar en la Cuarta Temporada de la Steemit Crypto Academy.
Felicitaciones!
Continua esforzandote, espero seguir corrigiendo tus asignaciones.
#club5050 😀
#club5050 😀