Heikin Ashi Trading Strategy - Crypto Academy / S4W2 - Homework Post for Professor @reddileep
Assalamualaikum and good morning everyone, welcome to the Steemit Crypto Academy season 4. This morning I will write a post about Heikin-Ashi Trading Strategy as a homework post for professor @reddileep and this is my third post in this season.
The professor has explained about the Heikin-Ashi Trading Strategy in the learning post that has been shared with this community and now it's time for the students to finish the homework that has been given, there are six main questions that must be answered in this homework and I will try to answer them in this post. I am very enthusiastic to start it because this is new knowledge for me.

Q1.) Define Heikin-Ashi Technique in your own words
Heikin-Ashi is a type of candlestick that can represent market conditions based on an average calculation involving a number of information contained in the previous candlestick, such as the opening price, closing price, high price, and low price so that each candlestick contained on the price chart will interconnected, today's candlestick is related to yesterday's candlestick and tomorrow's candlestick will be related to today's candlestick, and so on. That way, Heikin-Ashi can show smoother price chart patterns so that traders can more easily observe market conditions and can provide a good understanding of technical analysis.
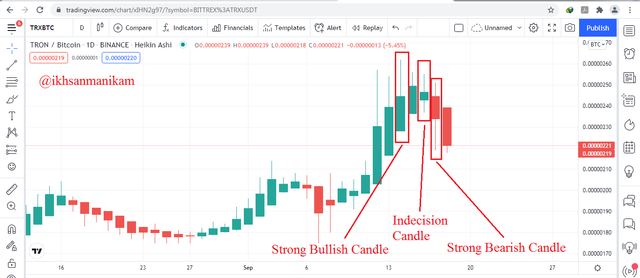
There are three parts to Heikin-Ashi and it consists of an upper wick, a lower wick, and a trunk or body. A green candlestick that has a thick body and long upper wick is usually considered a Strong Bullish Candle and a red candlestick that has a thick body and long lower wick is usually considered a Strong Bearish Candle whereas a thin-bodied Candlestick has a relatively long upper & lower wick almost the same can be considered as an Indecision Candle which can indicate a trend change or a trend cessation. It should also be noted that the color of the Heikin-Ashi will only change if the market trend has completely changed so that the displayed chart becomes more reliable.
Q2.) Make your own research and differentiate between the traditional candlestick chart and the Heikin-Ashi chart. (Screenshots required from both chart patterns)
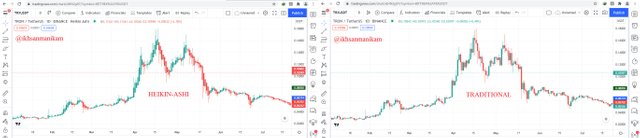
Based on the picture, it can be seen that visually Heikin-Ashi can display smoother chart patterns and tend to be more organized while traditional candlesticks look more complicated. Visually, market trends can also be more easily recognized by using Heikin-Ashi so that traders can more easily identify them. The color of the candles formed on Heikin-Ashi also tends to be more consistent in every trend that occurs because weak price changes will not change the color of the Heikin-Ashi candle and only strong price changes can change the color of the Heikin-Ashi candle while traditional candlesticks are not like that.
The initial position of Heikin-Ashi is always in the middle of the position of the previous candle because Heikin-Ashi uses the average price calculation contained in the previous candle while traditional candlesticks do not use such calculations so that the initial position of the traditional candlestick will continue naturally.
Q3.) Explain the Heikin-Ashi Formula and In addition to simply stating the formula, you should provide a clear explanation about the calculation
Open Calculation
This calculation is based on the average result between the two price categories formed in the market, namely the opening price and closing price.
Formula:
Open = (Open of Previous Candle + Close of Previous Candle) / 2
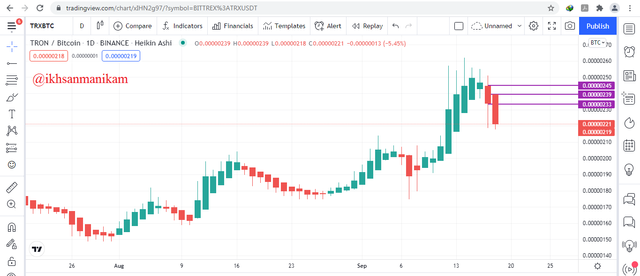
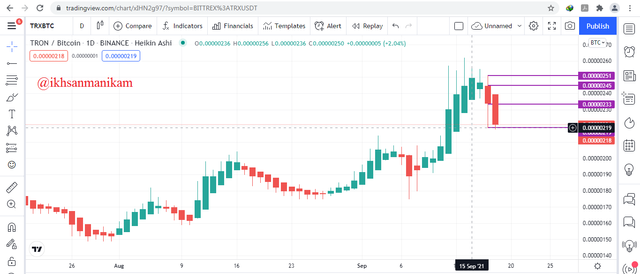
Calculation example based above picture data:
Open = (0.00000245 + 0.00000233) / 2 = 0.00000239
Close Calculation
This calculation is based on the average results of the four price categories formed in the market, namely the opening price, closing price, high price, and low price.
Formula:
Close = (Open + Close + High + Low of Current Candle) / 4
Calculation example based above picture data:
Close = (0.00000245 + 0.00000233 + 0.00000251 + 0.00000219) / 4 = 0.00000237
High Calculation
This calculation is done based on three price categories formed in the market where the high price is equal to the highest maximum price, the opening price, or the closing price of the current candle.
Formula:
High = Maximum Value of High, Open or Close of the Current Candle
Low Calculation
This calculation is done based on three price categories formed in the market where the high price is equal to the lowest minimum price, opening price, or closing price of the current candle.
Formula:
Low = Minimum Value of Low, Open or Close of the Current Candle
Q4.) Graphically explain trends and buying opportunities through Heikin-Ashi Candles. (Screenshots required)
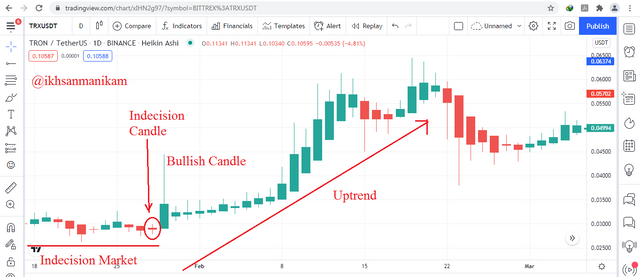
The short length of the candlestick wick is the main factor that can indicate the strength of the trend in the market based on the use of Heikin-Ashi. The long upper wick on the green candlestick indicates Strong Bullish while the long lower wick on the red candlestick indicates Strong Bearish. That way, traders can also consider Heikin-Ashi as a tool to determine selling and buying points in a trade.
In addition, market Indecision and Indecision candles are also one of the factors that need to be considered in this case because market trends tend to have the potential to change after the occurrence of these two conditions. When you see a Bullish Candle with a long upper wick and formed after the Indecision candle in the indecion market area, then you can consider placing a buy order because this is a signal of a trend change from Bearish to Bullish as seen in the picture above. To confirm it, you can also use a number of indicators that suit with your trade.
Q5.) Is it possible to transact only with signals received using the "Heikin-Ashi Technique"? Explain the reasons for your answer
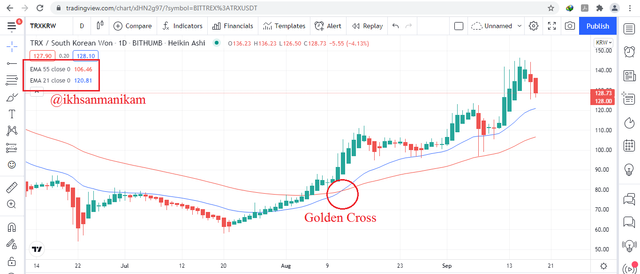
I can say that traders are not advised to focus on only one benchmark because it is too risky, including Heikin-Ashi because it cannot be said to be completely accurate. Therefore, traders are advised to use Heikin-Ashi in combination with several other technical indicators so that traders can confirm whether a signal can be considered or not and is a way to avoid false signals. One indicator that can help traders in the case of this combination is the Exponential Moving Average (EMA) and that way traders can confirm a signal in a better way of course. The golden cross that occurs as in the picture above can indicate a change in trend.
Q6.) By using a Demo account, perform both "Buy" and "Sell" orders using Heikin-Ashi + 55 EMA + 21 EMA
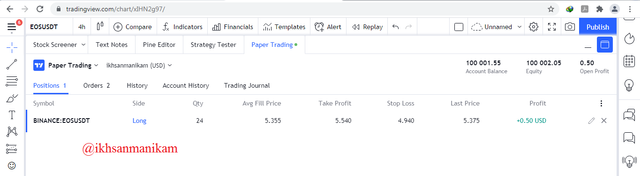
Buy Order
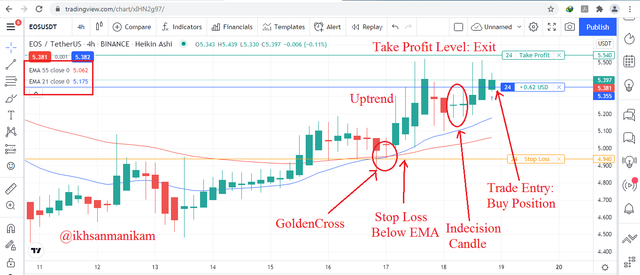
The bullish candle that formed after the Indecision candle and the Golden cross EMA indicated to me that this was a Buy signal and I immediately placed a Buy Entry by setting the stop loss slightly below the 55 EMA and the risk ratio was 1:2.
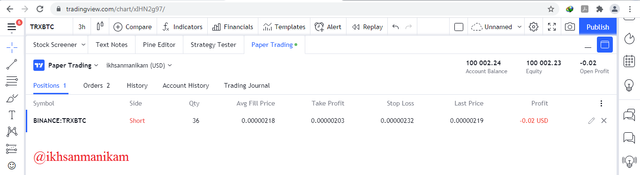
Sell Order
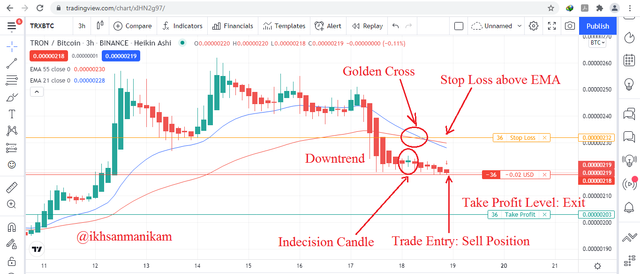
The bearish candle that formed after the Indecision candle and the Golden cross EMA indicated to me that this was a sell signal and I immediately placed a Sell Entry by setting the stop loss slightly above the 55 EMA and the risk ratio was 1:1.
Heikin-Ashi is an alternative to traditional candlesticks which are sometimes considered less attractive. To get better analysis results and chart readings, traders can use a number of additional indicators such as the RSI, MA and EMA. With this combination, traders will get better analysis results, of course. Using a timeframe that is too short can potentially generate a lot of false signals so traders are advised to use a longer timeframe. Traders also need to implement good trade management by always using stop loss.