[TRADING USING WEDGE PATTERN] - Crypto Academy / S5W5 - Homework Post for @sachin08".
Image Designed on Pixellab
Greetings everyone, I will be answering the questions on the lecture for trading using wedge pattern by professor @sachin08

1 Explain wedge pattern in your own words
The cryptocurrency market is one which is known for its volatility and over time traders have made it a point to study the patterns marked by such volatility and how it conforms to price change. One of those patterns is the wedge pattern.
.png)
Before going into detail of how wedge pattern relates to the crypto market, I would want to lay an understanding of it's basic meaning.
A wedge shape can be said to be one which is characterized by a triangle or a letter V looking shape.
Upon understanding it's basic appearance, we can now relate the wedge pattern to the cryptocurrency market.
It is characterized by the appearance of the top trendline which is the resistance and the bottom trendline which is the support in a converging position.
On the price chart we see both trendlines in an approach making them converge.
The wedge pattern is mainly used to predict a change in the trend for either a Bullish or bearish trend reversal. At the end of the pattern a breakout from one trend to another is expected.
It is characterized by a number of factors which are that the trendlines move in an approach pattern, then looking at the volume in relation to price movement we see a decrease, and also we see a breakout at the end of the wedge pattern.
Most important to note is that the trendlines have to converge or approach, it is this converging that makes them form a wedge.
Depending on the direction which it is facing a wedge pattern can either be rising or falling.
2 Explain two types of wedges and how to identify them
As I stated before there are two types of wedges and they are dependent on which direction they face, they both are
• Rising wedge
• Falling wedge
• Rising wedge
A rising wedge is a form of wedge pattern that is usually formed when the trendlines of support and resistance follow the market price in an upward bound movement or uptrend.

Both trendlines are converging on the price and at the breakout of the price we see a reversal into a bearish trend. This is why it is sometimes referenced as a bearish kind of wedge.
Traders take advantage of the possible reversal by making a sell entry while expecting a drop in the market price.
The formation of the higher lows are at a faster pace when compared to the higher highs creating a line which looks steep at the support. As they continue the lines begin to converge thereby forming a wedge pattern.
In the price chart displayed showing a market.
The price pattern was initially in an uptrend, in tbe uptrend formation we see the price touching the resistance and the support. The higher lows were formed faster in relation to the higher high giving it a steep movement this making them approach one another.
IDENTIFYING A RISING WEDGE
The Rising wedge pattern is usually characterized by a number of features which are used to correctly recognize and identify them.
• Firstly the movement of the price of the market at the formation of the wedge pattern is in an upward trend creating formation of higher highs and higher lows.
• The two trendlines which are the resistance and support converge on the price.
• The volume decreases in relation to the price movement signaling the nearing of a breakout.
• The price movement pattern should touch the trendlines on at least five or more than five points. Either two on the resistance and three on the support or the other way round.
Falling wedge
An opposite of the rising wedge is what is known as the falling wedge.
The falling wedge in this case can be used to predict a bullish trend. The support trendline and resistance trendline follow the market price in a downward trend or downtrend.
Here the price movement is in a downtrend with formation of lower highs and lower lows, as the two lines both approach and form the falling wedge.
As with the rising wedge we see a decrease in volume as the price nears a breakout, also we see a possible trend reversal into a Bullish one.
Traders use this opportunity by making a buy entry when there is a breakout in expectations of increase in price.
IDENTIFYING A FALLING WEDGE
Some of the things to look at in identifying a falling wedge are
• Here the price movement is in a downward trend with formation of lower highs and lows.
• The support and resistance lines meet in a downward trend
• The price touches the trendlines at least five times or it could be more. Minimum of two on one line and three on the other.
• Volume decreases in relation to market price as it is nearing a breakout.
3 Does the wedge patterns produce false signals at the breakout sometimes?
It is always mentioned that there is no perfect analysis or strategy as the cryptocurrency market can be very risky.
This is also applicable when we talk of the wedge pattern. False signals can emerge even after all criteria for formation are in place hence the use of other trading indicators to improve the quality of analysis.
The above shows a chart displaying the BTC/USDT market.
We can see that wedge pattern was formed and the breakout was an uptrend signaling a bullish trend but the pattern reversed back into a bearish trend.
Traders can fall victim of this fake signal and thereby loose funds.
One of the ways to detect fake signals is by using the wedge pattern alongside other technical indicators. One of such indicators is the Aroon.
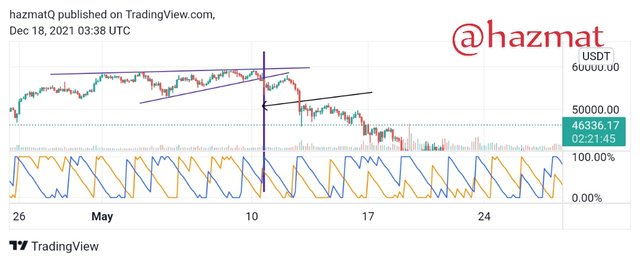
Here we see that the point of breakout coincides with the point of confluence between Aroon indicators showing that the breakout is less likely to be a false signal.
Wedge patterns even when used with other indicators are not 100% perfect hence traders have to be careful when entering a market to trade.
4 Demonstrate full trade setup using with the use of this pattern for both wedge types
I will be showing the trade setup for both a buy and sell entry when using the wedge pattern.
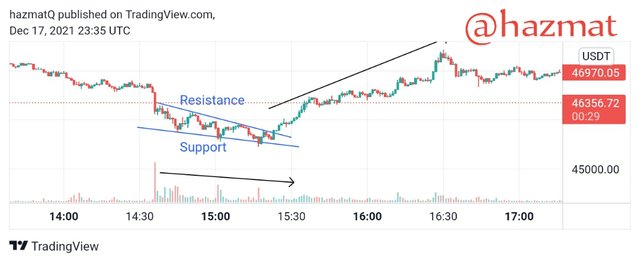
BUY ENTRY USING THE FALLING WEDGE PATTERN
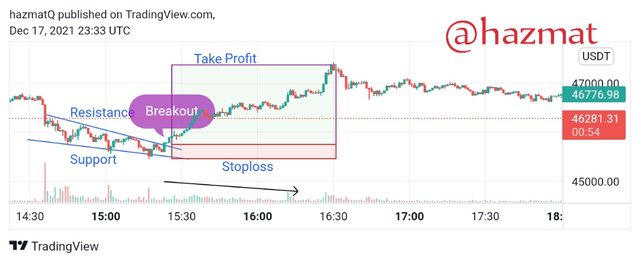
The chart displayed is one of the BTC/USDT market. From the pattern of the price movement we see that it touches both the resistance and support trendlines up to five times, also the trendlines are converging in a formation of a wedge pattern. We can also see that the volume is decreasing as we moved toward a breakout.
Having satisfied that it is indeed a wedge pattern, I made my sell buy entry at the breakout at 46265.12 , and took profit at 47622.31 then I made my stop loss at 45943.17.
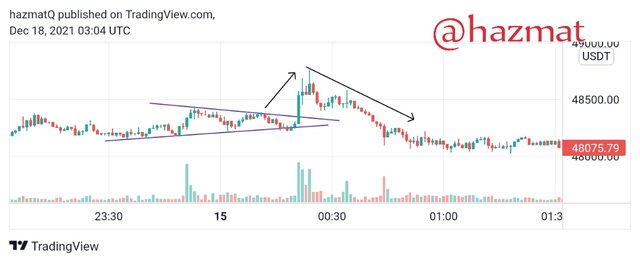
SELL ENTRY USING THE RISING WEDGE PATTERN
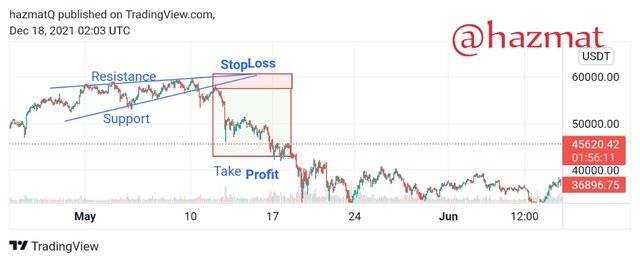
Chart displayed is a chart of the BTC/USDT market.
Having confirmed the formation of a wedge pattern I made entry into the market.
I made my sell entry at 57790.24, then I made my take profit point at 43448.44 and also my stop loss at 60416.3
CONCLUSION
Understanding of the wedge pattern as a trader can be very advantageous as it helps to predict when to make entry.
Although this is the first time I'm coming across wedge patterns as a means of trading. I can see the importance of them as a trading tool.
As seen wedge patterns also are not a 100% correct startegy to use in trading because fake signals can also occur, but I believe it is a very useful tool especially because of its simplicity to understand.