CONFLUENCE TRADING - Crypto Academy / S5W6- Homework Post for @reminiscence01".
Image Designed on Pixellab
Having read the lecture on confluence trading, this is my entry for the lecture.

1 Explain what is Confluence Trading?
Trading in cryptocurrencies as has been established is one market prone to risk because market price can be very volatile.
As a trader interested in taking profit from this vast market it is important to be aware of different market strategies used, one of those is known as Confluence Trading.
Before diving into confluence trading I believe it is pertinent to lay a basic meaning of confluence before relating it to trading.
Confluence ordinarily is a situation where there is a merging, joining or form of convergence between two things.
In relation to trading, Confluence Trading can be said to be a technique whereby a trader joins or merges two or more trade indicators to better improve accuracy of trade analysis.
Analyzing the crypto market to pick out the best trading opportunities can be very tricky as well as risky, one strategy might seem favorable but end up proving unreliable hence the need to balance the shortcomings of each indicator by applying others alongside it.
With the high volatility of the crypto market traders have to be sure to an extent before investing funds in a market, which is why using a confluence of trading strategies is a way to minimize the risk.
Enhancing a trade setup using confluence trading
The very essence of a confluence is to join, the price chart displayed is a market of ETH/ USDT trading.
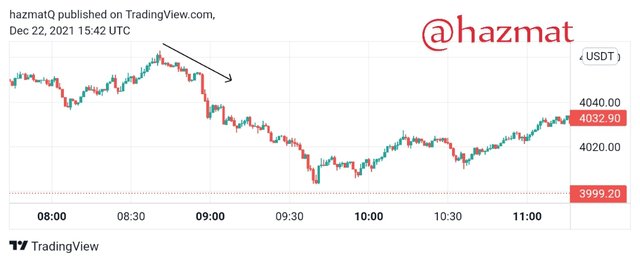
Here we see a bearish trend formation in price chart with the market price in a downtrend. Traders will not know when price may change hence it is required to use other trading indicators to confirm the market pattern before making an entry.
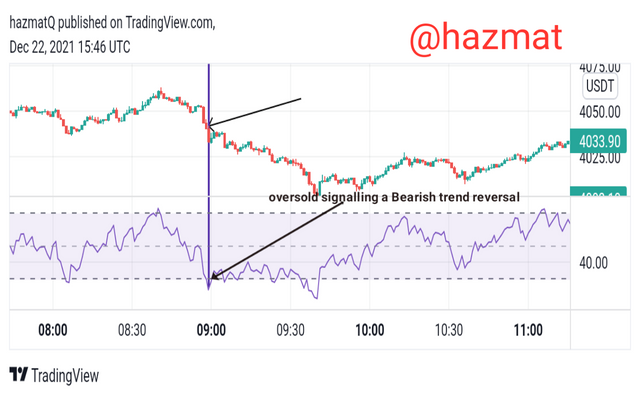
Here the RSI indicator known as the Relative strength indicator is used to confirm the price movement before an entry is made. The RSI indicates an oversold as it is between 0-20 range on the indicator. This shows that there is a possible bearish trend reversal and we should be expecting a bullish trend.
But before making an entry confirmation is made using another indicators just to be extra sure.
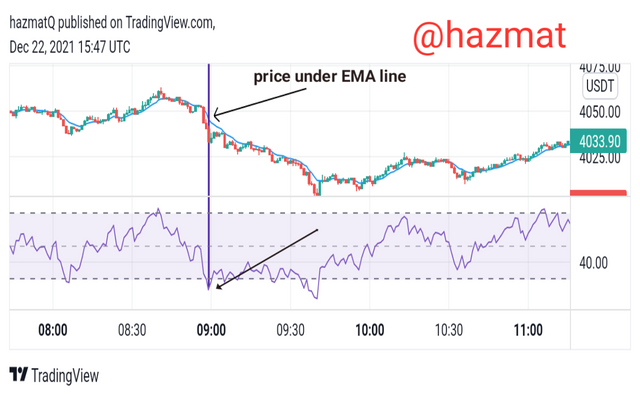
Now we use the EMA known as Exponential Moving Average to confirm the analysis made with the RSI. Here we see that the price is trading below the EMA line, showing that we should be expecting a bearish trend.
This is a contradiction between the two indicators hence the trader is advised to wait until another opportunity with the same analysis present itself.
We further see that the Bearish trend continues on, indicating that a false signal would have been followed if we used only the RSI indicator.
This is the reason why we use a confluence trading system to enhance trading.
2 Explain the importance of confluence trading in the market
Use of Confluence Trading has a lot of significance and importance, some of them are listed below.
ANALYSIS
The very essence of using the confluence trading is to improve the analysis of the market before making a trade.
By using different technical indicators, it increases the validity of the data gotten and the trader can make profitable trade.
VICTIM OF FALSE SIGNALS
Just as mentioned, the crypto market is only predictable to an extent because of its high volatility. Following a false signal will lead to loss of funds, but by applying two or more technical indicators for confirmation traders can greatly reduce the chances of falling victim of false signals.
IMPROVED SKILL
Using Confluence Trading involves incorporating different kinds of technical indicators, continuos usage is a learning process which can improve the skill and experience of the trader.
ACCURACY
It has always been said that no technical indicator is perfect to a hundred percent. But by using a confluence of trading indicators, this improves the accuracy to a better degree compared to relying on one technical indicator.
3 Explain 2 and 3 level Confirmation Confluence Trading .
2 Level Confirmation using Confluence Trading
The two level confirmation as the name implies is a situation whereby traders use two different technical indicators to make a trade entry.
Doing this involves confirming that the result on the analysis done on one trading indicator s the same result on another one this reducing possibility of following the a false signal and loosing funds.
I will be using the RSI and the Stochastic indicator to make confirmation.
The price chart displayed is a chart of the BTC/USDT market.
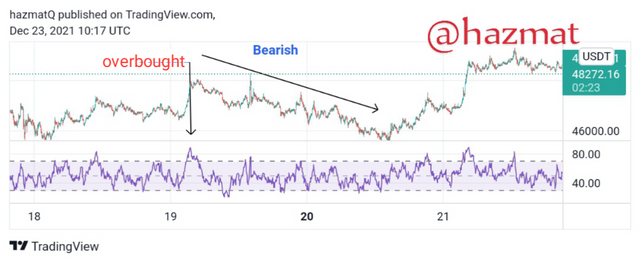
Using the RSI indicator we see that the indicator shows an overbought region meaning we should be expecting a bearish trend.
But going by Confluence Trading we need to make a confirmation first using another indicator.
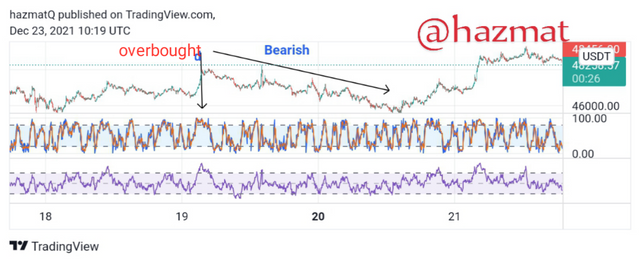
Now we use the Stochastic indicator alongside the RSI, both show an overbought region. So trader can make a sell entry expecting a bearish trend.
The image show that after the point of confirmation the market went on a bearish trend this confirming that it would have been a good entry if the trader followed the analysis from the inidcators.
3 Level Confirmation using Confluence Trading
The three level confirmation is the same as the two level confirmation but this is a step further by using an more indicators or strategies instead of just two as is the case with the two level.
I will be using the market structure, the RSI indicator and the Stochastic indicator.
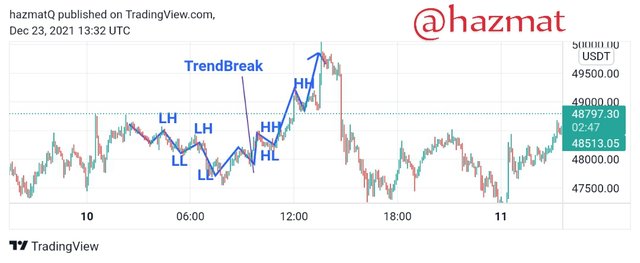
This is a price chart for the BTC/USDT market.
We see the movement of the market price in a formation of Lower highs and lower lows in a bearish trend, but at a point the low formed was not as low as the previously formed lower low, indicating that there could be a trend reversal.
But confirmation is done using other indicators.
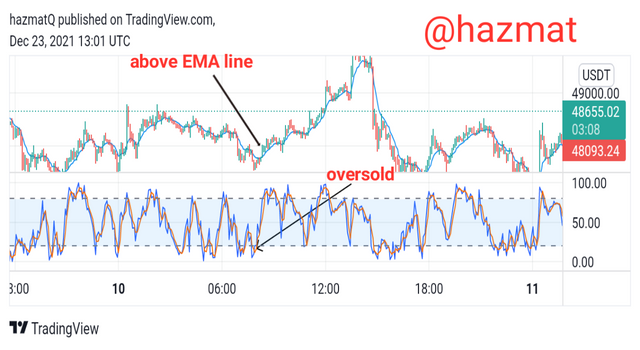
Using the Stochastic indicator, we see it is at oversold signalling that a bullish trend is to come, this is in line with analysis from market structure. Going a step further on the EMA line we see market price trading above the EMA line signalling it is a Bullish Trend.
All three indicates that a Bullish trend will be formed hence we can make entry.
4 Make a demo tade on two crypto asset pairs using Confluence Trading.
SELL TRADE ENTRY
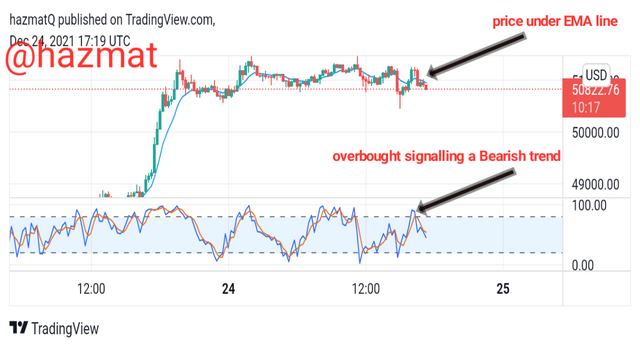
This is a price chart for the BTC/USD market.
The market is in a ranging phase because it is neither a bullish or bearish trend but a fluctuation in between both.
Using the EMA and stochastic indicators.
we see that the price is trading under the EMA line signalling a Bearish trend to come.
On the Stochastic indicator it is at overbought region also signalling a bearish trend.
A Bearish trend indicates a sell entry and with both in correlation I made a sell entry.
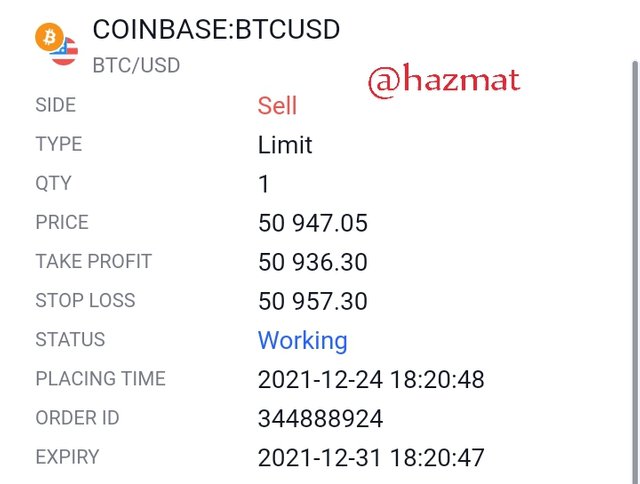
I made a sell entry at 50947.05, with take profit at point 50936.30 and stop loss at 50957.30.
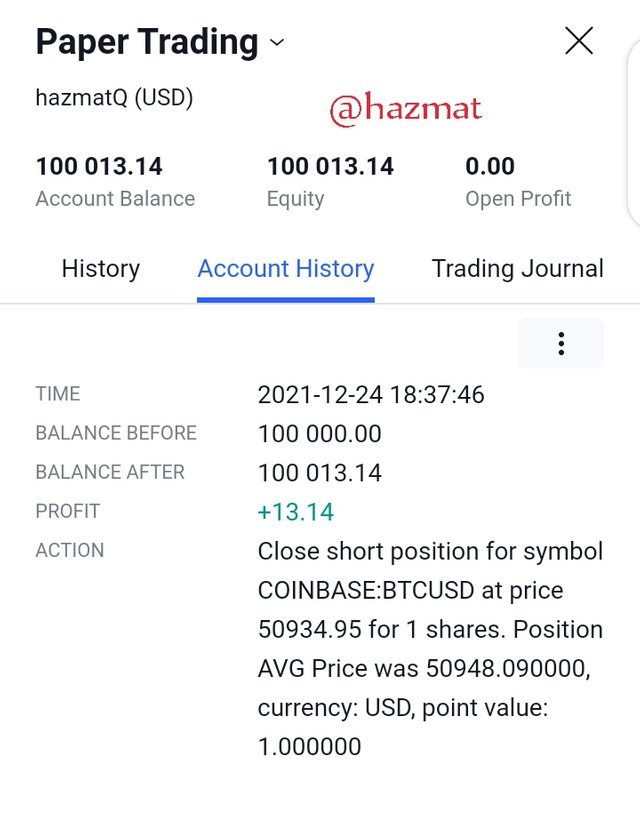
Results of my sell entry after the trade signalling it was a right entry.
All images used are sourced from tradingview site
CONCLUSION
Trading using a confluence of trading inidcators has a lot of advantages, traders would be in a best postion to trade if they are sure of the market they want to invest in.
So it's usage offers the trader not only an advantage of making profit but also broadens knowledge relating to different indicators and how to use them.
The cryptocurrency market can be easy or risky depending on how much effort you put into your analysis before trading.
Before rounding up I would like to still state that even with confluence trading it is not a perfect analysis.
I look forward to your review of my work professor @reminiscence01
Hello @hazmat, I’m glad you participated in the 6th week Season 5 of the Beginner’s class at the Steemit Crypto Academy. Your grades in this task are as follows:
Recommendation / Feedback:
Thank you for participating in this homework task.
Thanks professor
Hello @hazmat , I’m glad you participated in the 6th week Season 5 of the Beginner’s class at the Steemit Crypto Academy.
It is that you haven't powered up to 150 Steem in the last 30 days. This is a requirement for #club5050 and also a requirement to participate in the homework task.
Remark: Homework Task Disqualified
Professor @reminiscence01 I have just powered up and it is now up to 150.. please kindly review my work.. I only got out of the 150 range this morning
I would be glad if you kindly review my work, as I have powered up so as to reach the 150 steem range.
I only got out of the range today without me knowing if not I would have powered up before you checked my work..