Trading Steem with Fractals and Multi-Timeframe Strategies
Hello Steemians
I am excited to join Week 3 of the Season 20 Steemit Engagement Challenge Where we will be learning about Market Fractals. This tool created by Bill Williams help traders find points where the market might change direction.
.jpg)
In this post I will explain how fractals can help spot important moment in the price trends of the Steem token. I’ll also combine fractal with other tools like Moving Averages RSI and the Alligator Indicator to build a trading Plan that make my analysis more accurate.
Understanding Market Fractals |
|---|
Market fractals are patterns found in price movements of assets such as cryptocurrencies stocks or forex. These patternshelp trader identify potential trend reversals. Essentially fractal is a sequence of price action that repeat at different scale. Recognizing these fractal can provide insights into where the market might change direction.
How to Identify Market Fractal
To identify bullish or bearish fractal we look for Specific price condition:
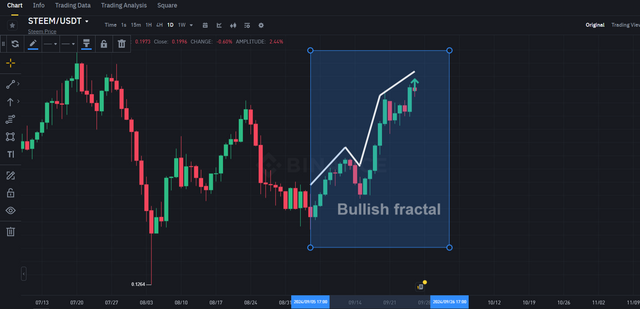
Bullish Fractal: This occurs when the price reaches low point and is surrounded by two higher price points on each side. It indicates a potential upward trend.
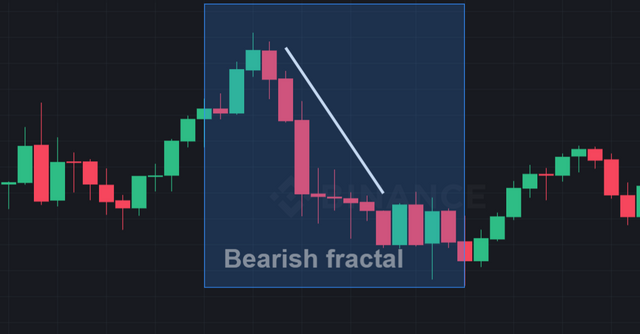
Bearish Fractal: This happens when the price peak and is surrounded by two lower price points. It suggests potential downward trend.
Example with STEEM/USDT Trading Pair
Let look at the STEEM/USDT trading pair and analyze the recent price data
Bullish fractal
- On September 26 2024 the price was 0.2007.
- The previous day showed the following prices:
- September 25 2024: 0.19172
- September 24 2024: 0.19389
.png)
From this data we can spot bullish fractal. On September 25 the price Was 0.19172 (the lowest) and on either side the prices were 0.19389 (higher) and 0.2007 (higher). This Pattern suggests that the market might be reversing to bullish trend after a low.
Bearish fractal:
- On September 22 2024 the Price Was 0.18842.
- On September 21 2024 the Price Was 0.1955 (higher) and on September 23 2024 it Was 0.19063 (higher).
In this case September 22 show peak indicating that the market Was Likely reversing to bearish trend after reaching 0.1955.
.png)
| Market fractals are useful tools for traders. By identifying these patterns I can better understand when a trend might reverse. For instance using the STEEM/USDT example I identified a bullish fractal that indicated a possible upward movement after low point as well as bearish fractal suggesting a potential downward trend after peak. Recognizing these fractal can enhance trading strategies and improve decision-making in the market. |
|---|
Combining Fractals with Other Indicators for Enhanced Trend Predictions |
|---|
Fractals are powerful tools in technical analysis particularly for identifying potential Reversal point in the Market. However their effectiveness can be significantly enhance when Combined with other indicators such the Relative Strength Index (RSI) moving averages or the Alligator indicator. Here I will discuss how these combinations can improve trends prediction using recent Steem chart as an example.
Understanding the Indicators
Fractals: These are patern that signal potential reversal. A bulish fractal occur When there is series of two lower highs surrounding higher high while bearish fractal has two highers low surrounding a lowers low.
Relative Strength Index (RSI): This momentums oscilator measure the speeds and changes of price movements oscillating between 0 and 100. Typically an RSI above 70 indicates over bought conditions while below 30 indicate over sold condition.
Moving Averages: These indicator helps smooth price action and identify trend . The Simple moving Average (SMA) and the Exponential Moving Average (EMA) are commonly used. A common strategy is to look for crossovers between differents moving averages such the 50 day and 200 day moving averages.
Alligator Indicator: This consists of three smoothed moving averages (Jaw Teeth and Lips) that help indicate the trend's strength and direction. When the Alligator is "eating " it suggest a strong trend.
Practical Example Using Steem Data
Lets analyze recent Steem price data to illustrate how these indicators can work together. Below is a snapshot of recent price movements:
.png)
| Date | Price | Change % |
|---|---|---|
| 9/26/2024 | 0.2007 | 4.68% |
| 9/25/2024 | 0.19172 | -1.12% |
| 9/24/2024 | 0.19389 | 1.71% |
| 9/23/2024 | 0.19063 | 1.17% |
| 9/22/2024 | 0.18842 | -3.62% |
- Fractal Analysis: On September 26 2024 We observe a bullish fractal as the price reached a high of 0.2007 surrounded by two lower high (0.19172 on September 25 and 0.19389 on September 24). This could indicate potential upward trend.
.png)
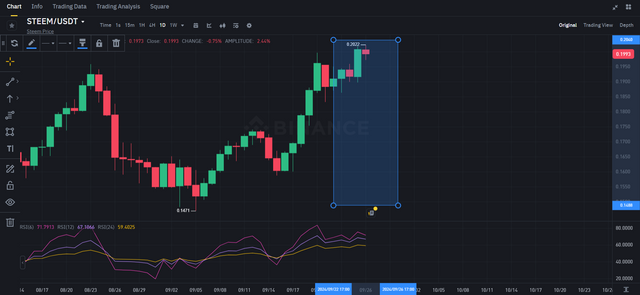
RSI Calculation: Let’s assume we calculated the RSI based on the last 14 day and it is currently at 65 suggesting the asset is approaching over bought conditions but not yet fully overbought.
Moving Averages: If we apply a 50 day SMA and observe that it has just cross above a 200-day SMA this would signal potential bullish trend.
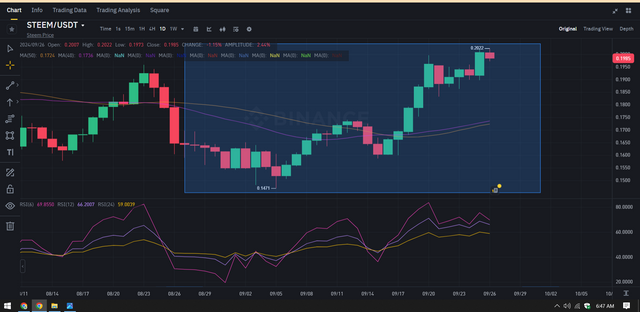.png)
- Alligator Indicator: If the Alligator three lines are diverging with the Lips (the fastest moving average) above the Teeth and Jaw this would reinforce the bullish outlook indicated by the fractal.
.png)
| Combining fractals with other indicator can lead to more informed trading decision. In this case the bullish fractal on September 26 2024 complemented by a strong RSI reading bullish crosover of moving averages and the Alligator indicator positive signals suggests that traders might expect further upward Momentum in the steem price. |
|---|
| By integrating these technical tools traders can enhance their Ability to predict market trend and make more effective trading decision. |
|---|
Using Fractals Across Multiple Time Frames: A Comprehensive Market Outlook |
|---|
Fractals are fascinating tools for trader offering insight into market reversals and continuation pattern. When applied across different time frame fractal can Provide layered perspective of market dynamics. Today I will demonstrate how fractals work on both daily and weekly chart of the Steem token and explain how they can interact to paint clearer picture of market directions.
Understanding Fractals
Before diving into the charts it's important to understand the basics of fractals. A fractal pattern typically consists of five or more bars and indicates potential reversal points in the market. In an uptrend a bearish fractal forms when the middle bar has a higher high than the bars surrounding it. Conversely a bullish fractal in a downtrend forms when the middle bar has a lower low than the adjacent bars.
Fractals serve as signals of potential shift in momentum but they become more powerful when combined with other technical analysis tool. For this analysis I will focus on how fractals interact across different time frames to provide holistic view of Steem market behavior.
Weekly Steem Fractals: Establishing the Bigger Picture
Lets start by analyzing the weekly Steem data. Looking at the last few week we can identify key fractals that help set the stage for our broader market outlook
Weekly Price Data (September - October 2024)
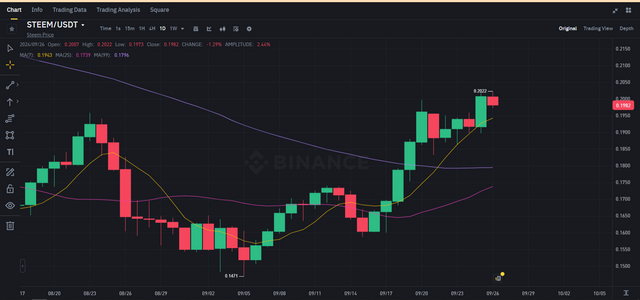
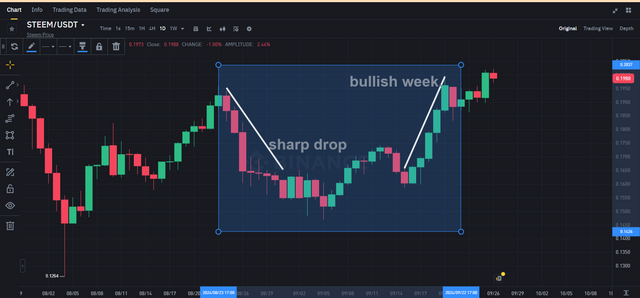
- 9/22/2024: Steem price closed at $0.20039 up by 2.50%.
- 9/15/2024: Steem price surged by 13.95% to $0.1955 a significant bullish week.
- 9/8/2024: Price closed at $0.17157 a 9.78% increase.
- 9/1/2024: Price saw a minor dip to $0.15628 (-3.44%).
- 8/25/2024: A steep decline (-15.75%) to $0.16185.
.png)
One of the most notable weekly fractals occurred around 8/25/2024 when the markets saw a sharp drop. This bearish fractal highlighted a potential reversal in the overall bullish momentum seen earlier in August. However after this fractal the market started to recover forming bullish fractal on 9/15/2024 as the price climbed from $0.17157 to $0.1955.
These fractals on the weekly chart give us high level view of market sentiment. The bullish fractal on 9/15 suggests upward momentum which need to be confirmed by the daily charts for more precise entry and exit point.
Daily Steem Fractals: Finer Market Details
Now lets zoom in on the daily chart to Complement the weekly analysis:
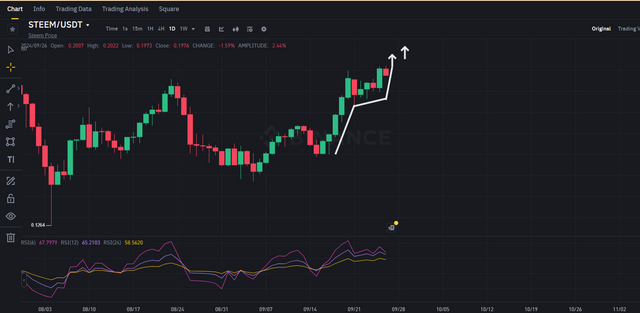
Daily Price Data (September 2024)
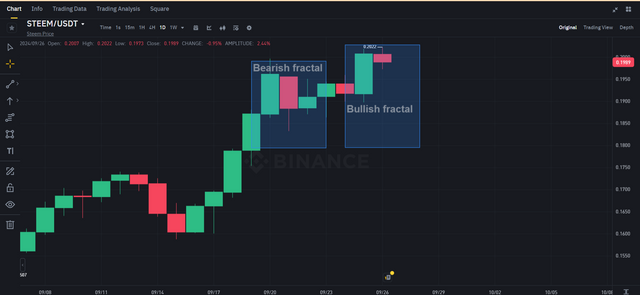
- 9/26/2024: Price closed at $0.2007 up 4.68%.
- 9/25/2024: Minor decline to $0.19172 (-1.12%).
- 9/24/2024: Price at $0.19389 up 1.71%.
- 9/23/2024: Increase to $0.19063 (+1.17%).
- 9/22/2024: Price dipped to $0.18842 (-3.62%).
.png)
Looking at the daily data we can identify key fractals around 9/22/2024 where a bearish fractal form after several days of upward momentum. This bearish fractal aligns with the weekly pattern indicating that a short term pullback was likely. However by 9/26/2024 bullish fractal formed on the daily chart signaling a potential upward reversal.
This interaction between daily and weekly fractal provides traders with a more detailed view of the market. The weekly fractal gives us the broader trend while the daily fractals help in timing entries and exits more precisely.
How These Time Frames Interact
Fractals on different time frames interact to provide comprehensive market outlook. In this case the weekly bullish fractal identified on 9/15/2024 showed a shift in market sentiment towards more positive outlook. The subsequent daily bullish fractal on 9/26/2024 confirmed this trend signaling that the short term dip around 9/22/2024 was only temporary.
Using fractals in this way helps me as trader to stay ahead of market movements. By analyzing both Daily and weekly charts I can form clearer picture of where the market might be headed and plan my trades accordingly. In this case the interaction of the bullish fractals on both time frame strengthen the case for a potential rally in the Steem price.
| Fractals are powerful indicators when used correctly especially across multiple time frames. By combining weekly and daily fractals on the Steem chart I have been able to gain a deeper understanding of the market's broader trends and more specific entry and exit points. The bullish fractals identified recently suggest that the market could continue its up ward momentum but as always it's important to monitor for any new fractal signals that could indicate shift in direction. |
|---|
Trading Strategy Using Fractals for the Steem Token |
|---|
Fractals are an effective tool for identifying potential reversals and setting Strategic entry and exit points in trading. They are formed when sequence of five bars has pattern where the highest high is preced and followed by two lower high or the lowest low is preced and followed by two higher lows. This Strategy will utilize fractals to trade the Steem token.
Step 1: Identifying Fractals on the Steem Chart
Example Fractal Setup
From the price chart data:
Bearish Fractal (Top Reversal):
- Date: 9/22/2024 High: 0.19538
- Date: 9/25/2024 High: 0.19657
Bullish Fractal (Bottom Reversal):
- Date: 9/20/2024 Low: 0.17555
- Date: 9/24/2024 Low: 0.18664
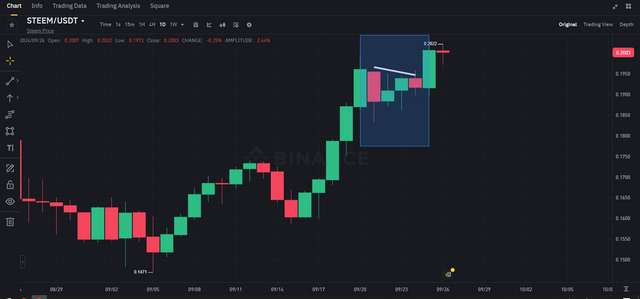.png)
These are recent fractals indicating potential reversal point for both bullish and bearish trend.
Step 2: Trading Rule Based on Fractals
1. Entry Strategy
- Buy Entry (Bullish):
Enter a long trade when a bullish fractal is confirme (i.e the market shows fractal low followed by reversal upward ). From the data the bullish fractal on 9/20/2024 (low of 0.17555) Was followed by an upward movement on 9/21/2024 (high of 0.19843) indicating buy Opportunity.
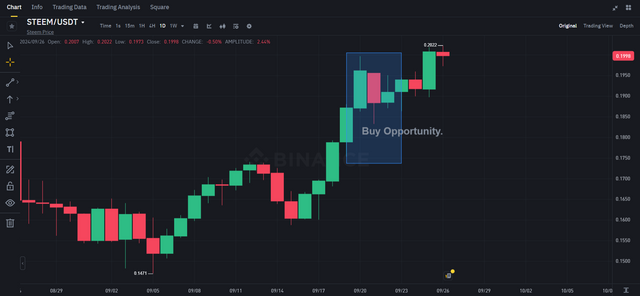.png)
- Sell Entry (Bearish):
Enter a short trade when a bearish fractal forms. A recent example is the fractal on 9/22/2024 (high of 0.19538) followed by downtrend which would trigger a sell entry.
2. Exit Strategy
Exit Long (Profit taking):
Exit your long position Once bearish fractal forms signaling a potential reversal. For instance after entering on 9/20/2024 at 0.17555 you Would exit the position around 9/25/2024 when a high of 0.19657 was reached as the bearish fractal forms.Exit Short (Profit taking):
Exit a short position when bulish fractal appears. For example after shorting on 9/22/2024 the position would be exite on 9/24/2024 When the price reach 0.18664.
3. Stop Loss Placement
For Long Trades:
Set the stop loss just below the most Recent fractal low (for instance the fractal low of 0.17555 on 9/20/2024 would mean a stop loss level Around 0.174).For Short Trades:
Set the stop loss above the most recent fractal high. In the case of the fractal on 9/22/2024 the stop loss Would be set just above 0.19538 around 0.196.
Step 3: Applying the Strategy with the Data
Example Buy Trade:
- Entry Date: 9/20/2024
- Entry Price: 0.17555 (bullish fractal confirmation)
- Stop Loss: 0.174 (set below the fractal low)
- Exit Point: 9/25/2024 around 0.196 (bearish fractal)
Example Sell Trade:
- Entry Date: 9/22/2024
- Entry Price: 0.19538 (bearish fractal confirmation)
- Stop-Loss: 0.196 (just above the fractal high)
- Exit Point: 9/24/2024 around 0.18664 (bullish fractal)
| Using fractals as part of trading strategy provide clear entry and exit points allowing trader to capitalize on potential market reversals. applying this strategy to Steem based on recent chart data helps ensure disciplined trading with clear risk management using stop loss order. |
|---|
Analyzing Steem’s Current Market Trend Using Fractals |
|---|
Over the past month Steem has shown some interesting movements in its price action I wll analyze its Current position using fractals along with supporting indicator such as the RSI and moving average. My goal is to determine whether Steem is currently in a bullish or bearish phase and to predict its next possible moves.
1. Fractal Analysis
Fractals are excellent tools for identifying potential reversal points in the market. By observing the price data for Steem in the last 30 days I have noticed several fractal highs and lows indicating shifts in market direction.
- Bullish Phase:
Steem has been in a bullish cycle since mid-September. After hitting a low of $0.16934 on September 19 the price Surge to $0.20059 by September 27. This movement clearly shows a fractal low formed on the 19th followed by higher highs and higher lows indicating a strong bullish trend.
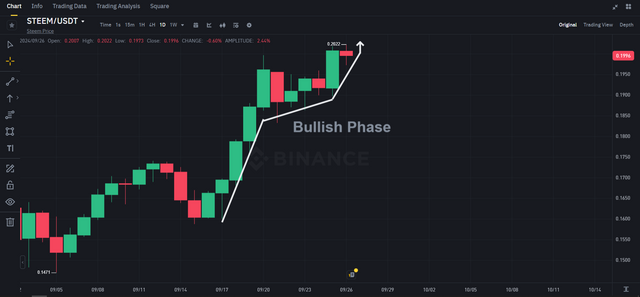.png)
- Bearish Corrections:
Despite this bullish move there were corrections in the market such as the dip from September 22 - 23. However these corrections are typical during uptrend and the market quickly recovered.
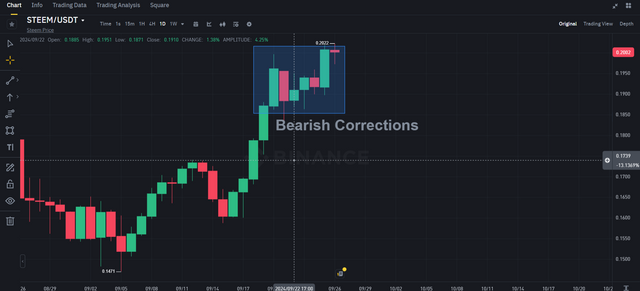.png)
In my analysis Steem appears to be in bullish fractal phase with the potential for further upward movement unless a significant fractal high forms indicating a reversal.
2. RSI (Relative Strength Index) Analysis
The RSI is important tool for determining whether market is overbought or oversold.
- When the RSI is above 70 the market is typicaly over bought signaling that a bearish corection could follow.
- When the RSI is below 30 the markets is over sold suggesting a bullish reversal may be near.
Given the recent uptrend Steem’s RSI is likely moving toward the overbought zone (above 70). This indicates that While the current bullish trend is strong a short-term correction might be on the horizon.
3. Moving Average (MA) Analysis
Moving averages (MA) are crucial for identify long term trends in the market.
- A 50-day moving average provides insight into short term trend.
- A 200-day moving average helps gauge long term momentums.
In bullish markets we look for Golden Cross Where the 50 day MA crose above the 200 day MA . Conversely a Death Cross occur When the 50 day MA falls below the 200 day MA signaling bearishne.
Based on the recent price action the short-term moving averages are likely trending upward and if this momentum continues we could see Golden Cross in the near future. This would further support the bulish trend.
4. Possible Next Moves for Steem
Upside Potential: If Steem continues its bullish cycle the next resistance point could be around $0.202. Breaking through this level could push the price toward $0.21-$0.22.
Downside Risk: If the market corrects the key support levels I will be watching are around $0.190 (recent support from September 24) and $0.180 which was the lower range in early September.
| Steem is currently in bullish fractal cycle with strong upward momentum. However indicators like the RSI suggest that the market may be approaching overbought conditions meaning we could see a short term correction before Steem resumes its upward trend. wil continue monitoring key support and resistance levels to confirm the strength of this trend and adjust my strategy accordingly. |
|---|
Thank you so much for reading my post i am inviting my friends.
@harferri
@mainuna
@rashid001
Upvoted. Thank You for sending some of your rewards to @null. It will make Steem stronger.
Dear friend, Thank you so much for voicing this great explomation again. Very nicely presented about fractal cycle. The analyzes are crystal clear and very well done. Hope you will try to present it more nicely in the future. Best of luck my dear friend.
Thank you so much for your feedback.. i am trying my best.
0.00 SBD,
0.01 STEEM,
0.01 SP,
0.00 TRX